Page 5 - TraceMetals_seagrass_algae
P. 5

L. Campanella et al. / Environmental Pollution 111 (2001) 117±126                                         121
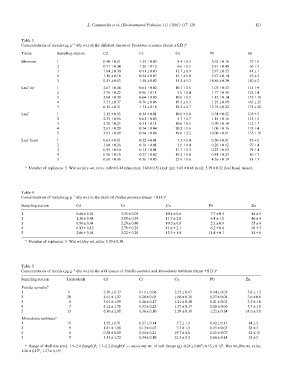
Table 3
Concentrations of metals (mg gÀ1 dry wt.) in the di€erent tissues of Posidonia oceanica (mean‹S.D.)a

Tissue                Sampling station  Cd                       Cr                      Cu Pb                          Zn

Rhizome               1                 0.40‹0.01                1.29‹0.03                8.4‹0.5           3.62‹0.16    57‹6
Leaf tip              2                 0.71‹0.24                1.28‹0.12                6.6‹0.5           2.81‹0.49    66‹5
Leaf                  3                 1.04‹0.30                0.91‹0.03               12.7‹0.9           2.87‹0.52    41‹1
Leaf basal            4                 1.16‹0.16                0.94‹0.07               15.1‹1.0           2.87‹0.14    95‹2
                      5                 0.45‹0.03                1.38‹0.02               15.3‹1.3          16.86‹0.30   140‹2

                      1                 2.67‹0.04                0.61‹0.02               10.1‹1.6           1.03‹0.03   114‹9
                      2                 3.76‹0.22                0.96‹0.11                5.0‹0.4           1.77‹0.38   122‹4
                      3                 2.60‹0.39                0.64‹0.05               10.0‹0.5           1.12‹0.14   135‹10
                      4                 3.53‹0.37                0.76‹0.06               19.3‹1.5           1.23‹0.09   163‹25
                      5                 6.12‹0.31                1.51‹0.18               18.3‹0.7          12.76‹0.22   171‹20

                      1                 1.13‹0.03                0.34‹0.01               10.0‹1.0           0.74‹0.02   105‹3
                      2                 2.33‹0.56                0.61‹0.03                5.7‹0.7           1.18‹0.16   114‹6
                      3                 2.78‹0.23                0.31‹0.11               10.6‹0.5           0.70‹0.10   112‹7
                      4                 2.63‹0.29                0.74‹0.04               20.2‹1.6           1.00‹0.16   118‹4
                      5                 3.03‹0.09                0.94‹0.08               19.6‹2.2          10.00‹0.01   155‹10

                      1                 0.63‹0.01                0.22‹0.01                7.5‹0.4           0.30‹0.01    85‹6
                      2                 1.00‹0.26                0.10‹0.01                5.0‹0.4           0.26‹0.02    97‹4
                      3                 0.95‹0.10                0.11‹0.01               11.7‹1.3           0.23‹0.03    79‹4
                      4                 0.98‹0.16                0.27‹0.02               19.2‹1.0           0.44‹0.23    86‹7
                      5                 0.68‹0.06                0.36‹0.05               23.9‹1.6           4.36‹0.19    81‹3

   a Number of replicates: 5. Wet wt./dry wt. ratio: 4.49‹0.44 (rhizome); 3.60‹0.51 (leaf tip); 3.60‹0.66 (leaf); 5.39‹0.32 (leaf basal tissue).

Table 4
Concentrations of metals (mg gÀ1 dry wt.) in the thalli of Padina pavonica (mean‹S.D.)a

Sampling station             Cd                    Cr                       Cu                             Pb               Zn

1                            0.66‹0.01             3.55‹0.05                10.4‹0.6                        7.7‹0.3         44‹5
                                                                                                            6.4‹1.0         46‹4
2                            1.56‹0.44             2.89‹0.34                11.7‹2.0                        5.2‹0.9         55‹4
                                                                                                            6.2‹0.4         69‹5
3                            0.86‹0.44             2.20‹0.40                10.5‹0.8                       11.4‹0.1         84‹6

4                            0.93‹0.12             2.79‹0.23                11.6‹2.1

5                            2.06‹0.04             3.22‹0.28                13.3‹1.9

   a Number of replicates: 5. Wet wt./dry wt. ratio: 5.39‹0.50.

Table 5
Concentrations of metals (mg gÀ1 dry wt.) in the soft tissues of Patella caerulea and Monodonta turbinata (mean‹S.D.)a

Sampling station         Individuals    Cd                       Cr                      Cu                Pb           Zn

Patella caeruleab        11             3.30‹0.37                0.19‹0.06               2.35‹0.67         0.14‹0.05     5.8‹1.5
1                        20             4.61‹1.22                0.20‹0.05               1.66‹0.38         0.27‹0.08     3.6‹0.6
2                         6             5.61‹1.99                0.46‹0.17               1.21‹0.30         0.21‹0.03     3.5‹1.6
3                         7             4.12‹1.70                0.33‹0.23               1.37‹0.37         0.16‹0.06     5.7‹1.8
4                        13             6.30‹2.08                0.36‹0.10               1.39‹0.38         1.52‹0.34    14.6‹3.8
5
                         15             1.92‹0.91                0.27‹0.14                5.7‹1.9          0.42‹0.13      14‹2
Monodonta turbinatac      9             1.81‹1.08                0.13‹0.03                7.3‹1.5          0.15‹0.03      38‹3
1                         6             0.58‹0.19                0.54‹0.21               19.7‹4.8          0.15‹0.07      42‹10
2                         9             3.35‹1.22                0.34‹0.10               21.5‹5.5          0.66‹0.14      55‹5
4
5

   a Range of shell size (cm): 1.9±2.4 (length)b; 1.7±2.2 (height)c Ð mean wet wt. of soft tissues (g): 0.24‹0.08b; 0.55‹0.12c. Wet wt./dry wt. ratio:
1.26‹0.12b; 1.27‹0.18c.
   1   2   3   4   5   6   7   8   9   10