
Page 6 - TraceMetals_seagrass_algae
P. 6
122 L. Campanella et al. / Environmental Pollution 111 (2001) 117±126
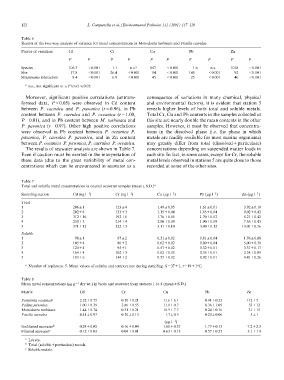
Table 6
Results of the two-way analysis of variance for metal concentrations in Monodonta turbinata and Patella caerulea
Factor of variation Cd Cr Cu Pb Zn
FP FP FP FP F P
Species 106.3 <0.001 1.1 n.s.a 847 <0.001 1.6 n.s. 1018 <0.001
92 <0.001
Site 17.8 <0.001 26.4 <0.001 14 <0.001 145 <0.001 46 <0.001
Site/species interaction 8.4 <0.001 6.9 <0.001 45 <0.001 25 <0.001
a n.s., not signi®cant at a P level 40.05.
Moreover, signi®cant positive correlations (untrans- consequence of variations in many chemical, physical
formed data, P<0.05) were observed in Cd content and environmental factors), it is evident that station 5
between P. caerulea and P. pavonica (r=0.96), in Pb reveals higher levels of both total and soluble metals.
content between P. caerulea and P. oceanica (r=1.00, Total Cr, Cu and Pb contents in the samples collected at
P=0.01), and in Pb content between M. turbinata and this site are nearly double the mean contents in the other
P. pavonica (r=0.97). Other high positive correlations samples. However, it must be observed that concentra-
were observed in Pb content between P. oceanica±P. tions in the dissolved phase (i.e. the phase in which
pavonica, P. caerulea±P. pavonica, and in Zn content metals are readily available for most marine organisms)
between P. oceanica±P. pavonica, P. caerulea±P. oceanica. may greatly dier from total (dissolved+particulate)
concentrations depending on suspended matter loads in
The results of seawater analysis are shown in Table 7. each site. In fact, in some cases, except for Cr, the soluble
Even if caution must be exerted in the interpretation of metal levels observed in stations 5 are quite close to those
these data (due to the great variability of metal con- recorded at some of the other sites.
centrations which can be encountered in seawater as a
Table 7
Total and soluble metal concentrations in coastal seawater samples (meanS.D.)a
Sampling station Cd (ng lÀ1) Cr (ng lÀ1) Cu (mg lÀ1) Pb (mg lÀ1) Zn (mg lÀ1)
Total 2061 1234 1.490.05 1.610.01 3.920.19
1 2028 1333 1.150.04 1.850.04 9.020.43
2 31216 1926 1.760.05 1.700.02 8.210.41
3 2503 2144 2.000.09 1.900.09 7.650.43
4 37112 3223 3.110.10 3.000.12 10.010.56
5
981 872 0.510.02 0.810.04 1.760.08
Soluble 1054 862 0.620.02 0.800.04 5.000.30
1 1244 951 0.570.02 0.320.01 3.310.17
2 1644 1023 0.820.03 0.350.01 2.340.09
3 1836 1442 0.550.02 0.920.01 4.410.26
4
5 Zn
1125
a Number of replicates: 5. Mean values of salinity and temperature during sampling: S=371, t=191C. 5312
3115
Table 8
Mean metal concentrations (mg gÀ1 dry wt.) in biota and seawater from stations 1 to 4 (meanS.D.) 51
Matrix Cd Cr Cu Pb 7.22.3
3.11.4
Posidonia oceanicaa 2.220.75 0.500.21 11.66.1 0.910.23
Padina pavonica 1.000.39 2.860.55 11.00.7 6.361.05
Monodonta turbinata 1.440.74 0.310.21 10.97.7 0.240.16
Patella caerulea 4.410.97 0.300.13 1.70.5 0.200.06
Un®ltered seawaterb 0.240.05 0.160.04 (mg lÀ1) 1.770.13
Filtered seawaterc 0.120.03 0.090.01 1.600.37 0.570.27
0.630.13
a Leaves.
b Total (soluble+particulate) metals.
c Soluble metals.