
Page 5 - 31 antonioli PAG 8-11
P. 5
Climex Maps - explanatory notes
Sea Level at 8 and 22 ka cal BP on Italian coastline
Antonioli F.1, Lambeck K. 2, Amorosi A.3, Belluomini G.4, Correggiari A.5, Devoti S.6, Demuro
S.7, Monaco C.8, Marocco R.9, Pagliarulo R.10, Orrù P.7, Silenzi S.6
1ENEA, Via Anguillarese 301, 00060 Roma, fabrizio.antonioli@casaccia.enea.it
2 Research School of Earth Sciences, National Australian University, Canberra, ACT 0200, Australia
3 Bologna University, Dip. di Scienze della Terra, Via Zamboni 67 - 40127 Bologna
4CNR, Laboratorio di radiodatazioni e Geochimica, Montelibretti, 00100 Roma
5CNR ISMAR- C.N.R. Sezione di Geologia Marina di Bologna, Via Gobetti 10-40129 Bologna
6ICRAM Central Institute for Marine Research, via Casalotti 300, 00166, Roma
7Dipartimento di Scienze Geologiche, Università di Cagliari,
8 Catania University,Dipartimento di Scienze Geologiche ,Corso Italia 55, Catania
9Trieste University,Dipartimento di Scienze Geologiche, Ambientali e Marine,
10CNR- Istituto di Ricerca per la Protezione Idrogeologica- Bari
1. Method 11 10 9 8 7 6 5 4 3 2 1 0
5
Sea level change along the Italian coast is the
sum of eustatic, glacio-hydro-isostatic, and 0
tectonic factors. The first is global and time-
dependent while the latter two also vary with -5
location. In order to drawn the palaeocostline
at 8 and 22 ka cal BP we used data published -10
from Lambeck et al., 2004. This paper contain
exhaustive description of ice-volume-equivalent RSL, m -15
sea level (esl) values, models, observed data
and error bars of the marker used for the -20
Italian sea level change occurred during last 20
ka. -25
"The dominant pattern of the sea levels for all
epochs is determined by the hydro-isostatic -30
contribution, with the sea basin floor subsiding
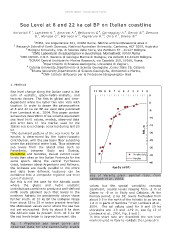
under the additional water load. Thus observed Versilia data -35
sea levels from the island sites such as Versilia -40
Pantelleria, between Sicily and Tunisia,
Marettimo and Sardinia, should exhibit lower Age (ky cal BP)
levels than sites on the Italian Peninsula for the
same epoch. Along the central Tyrrhenian site of Versilia plain, central Italy, from
coast, between about Argentario and Palinuro, Lambeck et al., 2004.
the isobases are nearly parallel to the shore
and data from different locations can be values but the spatial variability remains
combined into a composite regional sea-level significant, coastal levels ranging from -2 m at
curve if desired. Gabes to -9 m in Sicily and Calabria. At the
But this is not the case for the Adriatic coast Roman period, 2 ka BP, levels fluctuated from
where the glacio and hydro isostatic about 0.5 in the north of the Adriatic to as low as
contributions combine to produce a well-defined 1.8 m in parts of Sardinia." from Lambeck et al.,
north–south gradient such that levels in the 2004. The esl values used for 8 and 20 ka
northern Adriatic lie persistently above those shorelains are -13 and -149 m, see fig 12 of
further south. At 10 ka BP the isobases range Lambeck et al., 2004, Fig. 1 and 2.
from about 55 to 35 m below present level but In this short note are described the sea level
the shallowest values occur where the sea has markers used in Italy to validate the Lambeck's
not yet encroached. Only by about 8 ka does
the Adriatic take its present form. At 6 ka BP
the sea levels begin to approach present-day
Fig. 1 Predicted sea level curve and
observed data for the tectonically stable