
Page 8 - Coletti_al2016
P. 8
Carnets Geol. 16 (3)
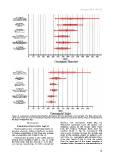
Figure 5: Comparison of conceptacle chamber dimensions between fossil and recent samples. The long red bar indi-
cates total range; the pale red rectangle indicates the standard deviation around the average which is represented by
the large vertical black bar.
Discussion diameter and conceptacle height (Fig. 5).
Pleistocene specimens have the largest con-
COMPARISON BETWEEN FOSSIL SAMPLES ceptacles among all the fossils, while those
from the Tertiary Piedmont Basin have the
Fossil samples have a remarkably similar ve- smallest (Table 2; Fig. 5). Conceptacle H/D
getative anatomy, without significant variation ratio is very consistent among the samples and
in thallus organization or the range and average most of the average values lie between 0.33
size of vegetative cells (Table 2; Fig. 2). and 0.34, i.e., conceptacle with diameter three
times their height (Table 2). Only the sample
Reproductive anatomy is also rather uniform from the upper part of the Lower Langhian of
among fossil samples (Table 2; Fig. 3). Both Lopadea Veche (Romania) is characterized by a
the total range and the average (± s.d.) inter-
val overlap consistently, for both conceptacle
34