
Page 7 - Grillini2015
P. 7
Research & development
determination of major cations and trace elements, sector of the island has a ground elevation (averaged
while the second was kept for anion determination. on the sites of the wells) of 15.35 m, and a water table
Once collected, the samples were immediately level of 0.26 m a.s.l. In the eastern sector, with an
stored at 4 °C waiting for the laboratory analyses. average ground altitude of 9.21 m, the water table
• For each well, the whole operation of sampling has level is 0.29 m a.s.l. Here a further distinction can be
taken about one hour and half. made, most of the wells being concentrated in the
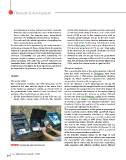
For each well, the data registered by the multiparametric centre of Favignana, with a mean ground elevation of
probe were compared to those obtained from the samples 6.13 m and a water level of 0.31 m a.s.l.: other wells,
collected in parallel and analysed with the portable field in the rural east, lie at a ground elevation of 21.53 m
analyses equipment (Figure7):the results(fortemperature, showing a water level of 0.21 m a.s.l.
electrical conductivity and pH) were satisfactory, the 2. Between the wet and the dry season the groundwater
average deviation between probe and field instruments levels show,on average,a difference of 2-3 cm,that is less
never exceeding 10%, with very good R2 values for the than 10%.In detail,in the western sector the difference is
correlation lines. Only for the Eh data no correlation has 3.8%, and in the eastern sector is equal to 8.8%.
resulted but, according to the field experience, this was to
be expected in the presence of brackish waters. Chemical analyses
The concentration data of the water samples collected
Results from the wells monitored in Favignana have been
projected onto a Chebotarev quadrangular diagram
The water table (Figure 8), which allows to represent the chemical
The comparison between the GPS elevations of the composition of water with a single point.
ground in the sites and the depth of the water level From the diagram a wide differentiation among the
in the wells has allowed to outline an overall view of waters coming from the sampled wells can be inferred:
the groundwater table levels all over the island. The in particular the sample from the well FA16 (Figure 8)
analysis of the results shows up two points: can be considered end-member of the waters flowing
1. All the groundwater levels lie in the 0-50 cm a.s.l. through the calcarenitic terrains so widely diffused
all over the island of Favignana, mainly in the eastern
range, with a mean value of 28 cm. The western sector: in fact, it shows a relatively abundant content
of calcium, magnesium and hydrogencarbonate ions;
FIGURE 7 Checking the data from the probe therefore it falls in the quadrant of the waters classified
as bicarbonate-alkaline-earth waters.
The opposite end-member of the group is represented
by the brackish waters (wells FA26 and FA15, Figure
8), with a high concentration of sodium (≈ 1500 mg/L)
and chloride (> 2400 mg/L) ions, and with an electrical
conductivity in the order of 9000 µS/cm. These waters
are classified as sulfate-chloride-alkaline waters.
The rest of the waters show characteristics that are
intermediate between bicarbonate-alkaline-earth and
the sulfate-chloride-alkaline waters, with a prevalence
of the bicarbonate-alkaline-earth kind.
In the Schoeller diagram (Figure 9), the slope of each
segment joining the points of two different ions represents
the characteristic ratio between those two ions: parallel
segments denote waters with the same ionic composition,
while segments with different gradient denote different
24 EAI Energia, Ambiente e Innovazione 4/2015