
Page 8 - Grillini2015
P. 8
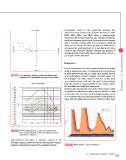
FIGURE 8 	 The Chebotarev diagram: water classification and       Particularly, most of the segments forming the               Research & development
              evolution of the groundwater chemical composition   distinctive lines of the water samples taken from wells
                                                                  FA04, FA13, FA15, and FA26 show a quasi-parallel
                                                                  trend, not only reciprocally, but also compared with the
                                                                  standard seawater line used as a comparison (sea water
                                                                  with a salinity of 35‰) [45]. These samples, showing
                                                                  electrical conductivity values exceeding 7000 µS/cm,
                                                                  represent the end-members of a geochemical facies
                                                                  evolved into chloride-alkaline through the mixing of
                                                                  originally fresh water with other saltier water due to a
                                                                  probable marine intrusion.

                                                                  Discussion

                                                                  Both in the western and in the eastern sectors, the water
                                                                  table is always few tens of centimeters above sea level,
                                                                  in wells where the mouth is as high as 32 meters as well
                                                                  as in wells where it is just a couple of meters above sea
                                                                  level (Figure 10). This result is evidence of the poor
                                                                  groundwater resource all over the island, independently
                                                                  from the nature or characteristics of the terrain, where
                                                                  the well has been drilled or excavated.
                                                                  Between the wet and dry season the water table shows
                                                                  no significant differences, since they are limited to a few
                                                                  centimeters. Oh the other hand, the Favignana’s people
                                                                  is accustomed since the first prehistoric colonization to
                                                                  cope with drought and poor water resource: they have

 FIGURE 9 	 The Schoeller diagram: comparison between the         FIGURE 10 Water levels vs. ground elevations
               ionic concentrations from the groundwater samples
               collected in Favignana

hydrochemical characters. A detailed analysis of the
Schoeller diagram created for these water samples confirms
a similar composition for most of the examined waters.

                                                                  25EAI Energia, Ambiente e Innovazione 4/2015