
Page 5 - Iannucci_alii_2015
P. 5
GNGTS 2015 SESSIONE 3. 2
A3- May 27 A3- May 30
12QOO- 12QOO-
___ Up·Down
--- Up-Oown
comp. oomp.
--- N·S comp. --- N·S oomp.
--- E·W oomp. --- E·W oomp.
~ 8000-
~
~
E
i .
VI 4000-
r· rr;o 20 'l "l 20 40 60
40 60
Frequeocy (Hz) Frequency (Hz)
6-
_ Average --- ~~rage
H/V
5- 5-
4-
oì ' ' 1'"1 11 ! 1 ' ~ ' '' ~ 'tT,b
0.4 0.6 0.8 l ~ . ' '4 l},' rlh ' 20 l
Frequency (Hz) Frequency (Hz)
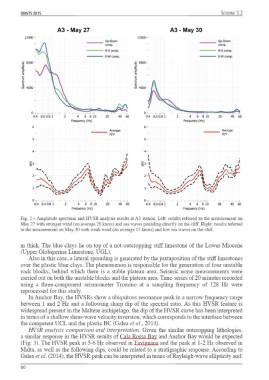
Fig. 2 - Amplitude spectrum and HVSR analysis results at A3 station. Left: results referred to the measurement on
May 27 with stronger wind (on average 20 knots) and sea waves pounding directly on the cliff. Right: results referred
to the measurement on May 30 with weak wind (on average 15 knots) and low sea waves on the cliff.
1ll thick. The blue clays lie on top of a not-outcropping stiff lilllestone of the Lower Miocene
(Upper Globigerina Lilllestone, UGL).
Also in this case, a lateral spreading is generated by the juxtaposition of the stiff limestones
over the plastic blue clays. The phenolllenon is responsible for the generation of four unstable
rock blocks, behind which there is a stable plateau area. Seismic noise Jlleasurelllents were
carried out on both the unstable blocks and the plateau area. Tillle-series of 20 Illinutes recorded
using a three-colllponent seislllollleter Trolllino at a sampling frequency of 128 Hz were
reprocessed for this study.
In Anchor Bay, the HVSRs show a ubiquitous resonance peak in a narro w frequency range
between l and 2 Hz and a following sharp dip of the spectral ratio. As this HVSR feature is
widespread present in the Maltese archipelago, the di p of the HVSR curve has been interpreted
in tenns of a shallow shear-wave velocity inversion, which conesponds to the interface between
the competent UCL and the plastic BC (Galea et al., 2014).
HVSR analysis comparison and interpretation. Given the silllilar outcropping lithologies,
a similar response in the HVSR results of Cala Rossa Bay and Anchor Bay would be expected
(Fig. 3). The HVSR peak at 5-6 Hz observed in Favignana and the peak at 1-2Hz observed in
Malta, as well as the following dips, could be related to a stratigraphic response. According to
Galea et al. (2014), the HVSR peak can be interpreted in tenns ofRayleigh-wave ellipticity and/
60