Page 6 - Iannucci_alii_2015
P. 6

GNGTS 2015                                                             SESSIONE 3. 2

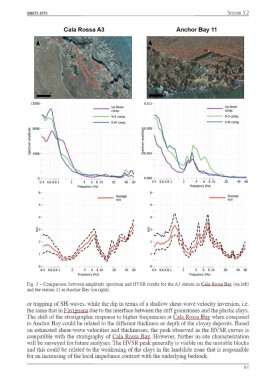
                        Cala Rossa A3                           Anchor Bay 11


            12000-                                   0.012-
                                  ___ Up-Down                              _      Up·Down
                                         com p.                                  oomp.
                                  --- N·S comp.                            --- N·S oomp.
                                  --- E·W comp.                            --- e-w comp.
           ~ 8000-                                  ~0.008-
           l  -                                     't.   -
                                                    ..
                                                    E
           e
           i 4000~                                  t004-


              oì '  '1"'1"'1   '''  ' 'l  1"'1   io  ' '40"  61>   o.oooì  ' ''l  l' 'l
               0.4  0.6 0.8 1   4   6  8  IO           0.4  0.6 0.8  l           20
                             Frequency (Hz)                          Frequency (Hz)
               6-                                      6-
                                           A~e                              --- ~rage
                                    --- H(V
               s-                                      s-
               4-


                            ' '' 4 "6"'/l'l'o   20   40  60   oì  ' '  l  " l '  'l   4  l  "l l"  11 '"1
                                              l  "
                                                 l
                                          l  '  "
                                                       0.4  0.6 0.8 l
                                                                          6  8  10
                             Frequency (Hz)                          Frequency (Hz)
           Fig. 3 - Comparison  between amplitude spectrum and HVSR results for theA3 station in Cala Rossa Bay (on left)
           and the station 11 in Anchor Bay (on right).
           or trapping of SH-waves, while the dip in tetms of a shallow shear-wave velocity inversion, i.e.
           the same that in Favignana due to the intedace between the stiff grainstones and the plastic clays.
           The shift of the stratigraphic response to higher frequencies at Cala Rossa Bay when compared
           to Anchor Bay could be related to the different thickness or depth of the clayey deposits. Based
           on estimated shear-wave velocities and thicknesses, the peak observed in the HVSR curves is
           compatible with the stratigraphy of Cala Rossa Bay.  However, fmther in-site characterization
           will be smveyed for futme analyses. The HVSR peak generally is visible on the m1stable blocks
           and this could be related to the weakening of the clays in the landslide zone that is responsible
           for an increasing of the local impedance contrast with the underlying bedrock.

                                                                                        61
   1   2   3   4   5   6   7   8