
Page 10 - Ragg_et_al-1999-Tectonics
P. 10
678 RAGG ET AL.: TECTONIC STRESS IN SICILY
Angelo Ramacca Catania Plain
s "X•, 2 1. Foredeep.
WesternSicily HybleanPlateau
Gela SHmax orientations
DataqualityA
DaqtauaBlitty
DatqaualiCly t
DataqualityD I
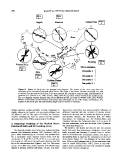
Figure 9. Sketch of Sicily with six groupedrose diagrams.The arrows of the stressmap show the
orientationof the maximumhorizontalstressShmax.The lengthof the arrowsindicatesthe qualityof a well
asdeducedfrom thestandarddeviationof themeanazimuth,thecumulativebreakoutlength,andthenumberof
breakoutsin it [Zobacket al., 1989,Zoback, 1992]. Note thebig scatterof datalocatedin the foredeeparea.
The rosediagramscombinebreakoutdatafor the differenttectonicunitssuchas westernSicily, Gela, Hyblean
Plateau,CataniaPlain and the foredeepandpresentdataindividuallyfor the wells AngeloandRamacca.The
numbersin the boxesgive the total breakoutlength and the numberof breakouts.
SHmax direction swings northerly to keep orthogonal or dimensionalmodel takes into accountpossible influences of
slightly oblique to the bended and segmentedcollision front
(seeFigures 1 and 10). The region of the Etna, the Calabrian different materials and the variation of elastic crustal
orocline, including the back arc sectors and the southern
ApenninesshowNS to NNE averagedtrendof the SHmax. thicknessin the studyarea. It includesthe following geologic
and tectonic features: the Pantelleria Rift, the Malta
5. Numerical Modeling of the Marked Stress
Patterns of Sicily and Surrounding Areas Escarpment, the Calabrian Arc, the Hyblean-Malta and
AdventurePlateaus,the CaltanissettaBasin with its up to 10
The observedcomplex stresspatternwas modeledby finite km thick sedimentarycover and the basinsof the Tyrrhenian
element (FE) techniques[Kohnke, 1987; Beekman, 1994] to andIonian Seas(Figure 1).
gain a better understandingof its sources.The modeled area
has a rectangular shape centered around Sicily with the The model is very simple and does not take into account
coordinates (11øE, 40øN) to (17øE, 35øN). It is a model with forces that result from temperature, subduction,minor local
faults, or gravity and buoyancy.It extendsfrom the surface
sidelengthosf-480 kmin thenorth-soudtih/ectioannd520 downto the Mohorovicicdiscontinuity(Moho). The shapeof
the modeledMoho is basedon the interpolationof observed
km in the west-eastdirection (Figures 1 and 1l a). The model Moho depths (Figure 11). The thicknessof the crust varies
consists of 11,000 linear elastic elements with 24,000 nodal from 10 km at the TyrrhenianSea to 40 km underneathlarge
degreesof freedom (element side length -10 km). This three- areas of central Sicily [Geiss, 1987]. Down to this well-
markedseismicboundarythe crust was assumedto display
linear elastic behavior throughout.