Page 14 - Ragg_et_al-1999-Tectonics
P. 14

682 RAC• ET AL.' TECTONIC STRESSIN SICILY

                                                                                           of the state of stress in the upper crust. No systematic
                                                                                                      coherence between the brehkout orientation and the
                                                                                         stratigraphy(Figures4-8) was observed.

                                                                                               From the comparisonof observedstressesand the modeled
                                                                                           stressfield we summarizethe following conclusions:

                                                                                              1. In spite of the very complex stress pattern that is
                                                                                          indicatedthroughthe observeddata and the interpolatedstress

                                                                            fieldof theMediterraneaitni,s possiblteo trace,backmostof

                                                                                         this patternto a simple model that includesonly the crustal
                                                                                              structure(elastic thickness)and the main tectonic featuresthat
                                                                                           are the PantelleriaRift and the Malta Escarpmentacting in a
                                                                                           far-field that showsa NNW-SSE orientation(Figure 13).

                                                                                              2. The influence of the opening of the Pantelleria Rift
                                                                                         appearsto be dominantin central Sicily. From the modelone
                                                                                          could predict that on the northern shoulderof the Pantelleria
                                                                                                      Rift the SHmax orientation turns from NNW to NE, that is,
                                                                                          orthogonalto the spreadingaxis, whereason the rest of the
                                                                                             rift and adjacent sectors, the stress field does not rotate
                                                                                            significantly.

                                                                                             3. A possible hypothesis to explain that the NE
                                                                                          compressiondoesnot propagateon the Hyblean Plateauis the
                                                                                            occurrencealongthe westernmargin of the Hyblean Plateauof
                                                                                            a large transferzone (Acate, Comiso, and Scicli fault system,
                                                                                            seeFigure 1) which accommodatesdifferent ratesof spreading
                                                                                              of the Pantelleria Rift by dextral movement [Grasso and
                                                                                                Reuther, 1988]. Thus it inhibits the stress transfer to the
                                                                                             Hyblean Plateau.

                                                                                              4. The large scatterof the data in foredeep(Figure 9) could
                                                                                         be explainedby flexural tensile stresseswhich superimpose
                                                                                             the regional stressin sucha way that when tensile stressesare
                                                                                          predominant,the resulting stressis oriented NNE-SSW, that
                                                                                          is, parallel to the flexural downbendingof the underthrusting
                                                                                          African plate margin [Adam and Reuther, 1995]. Comparing
                                                                                             the modeled magnitudes of the horizontal stress in the
                                                                                         foredeep,it is obviousthat nearly all wells with a dataquality
                                                                                             of D are locatedin an area with modeledisotropicstressesT. he
                                                                                          reasonfor the isotropy could be the reduction of the NNW
                                                                                          compression by NNW tensile stresses, since geological
                                                                                          evidenceandthe regionalstructuralsettingof the areaallow us
                                                                                          to rule out activeENE compressionwith similar magnitudesin
                                                                                         comparisonwith the far-field stress.

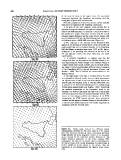
                                                                                       Figure 12. Stress maps derived for different model
                                                                                        configurations(seeTable 4). The stresssymbolsof the models

                                                                                                            show the maximum horizontal stress orientation and their

                                                                                         lengthindicatesthe stressmagnituderelative to the maximum

                                                                                                         stress obtained for the individual models. Because of the

                                                                                          elastic material properties in the finite element (FE)
                                                                                      computationthe scaleof the absoutevaluesis determinedby
                                                                                           the displacementsat the model boundaries,for which there is
                                                                                           certain variability in the choice of the values. Thus we
                                                                                          consideredin our interpretations the relative stress values
                                                                                              only.
   9   10   11   12   13   14   15   16   17