
Page 13 - Ragg_et_al-1999-Tectonics
P. 13
RAGG ET AL.: TECTONIC STRESS IN SICILY 681
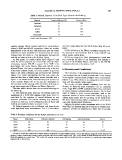
Table 3. Material Propertiesof the Reck Types Used for the Modeling
Material Young'sModulus,GPa Poisson'sRatio
Sediments 40 0.28
Carbonates 65 0.33
65 0.25
Granite 116 0.34
Gabbro
75 0.18
Metamorphic
From Landolt-Boernstein[1982]
opening strongly affects central south Sicily where SHmax with the resultsshown by the World StressMap [Zoback,
rotates to ENE and NE-SW orientations, which are roughly 1992].
perpendicularto the rift axis. This model may give the correct
trend for the stressorientations in western Sicily and in the (3) The deflection of the SHmax orientation connected with
Catania Plain, but there is a big discrepancy between the the opening of the Pantelleria Rift is toward NE-SW and
modeledand observeddata on the Hyblean Plateau. affects mostly central Sicily.
As final model, we consider model Siz40 (Figure 13 and (4) The modelingof the Malta Escarpmentas a weak fault
Table 4), which representsthe trend of the observed stress zone overstripsthe effect of the PantelleriaRift openingin
orientations, namely, NW-SE in western Sicily, NNE in the the area of the Hyblean Plateau and leads to the NW-SE
Gela Nappe, NE in the Catania Plain, and NW-SE in the orientationobservedon the plateau itself.
HybleanPlateau.We want to emphasizethat owing to the grid
of the finite element model, it is only possibleto give the 6. Discussion and Conclusions
trend of the stressorientation and not exactly the observed
values. It is worth highlighting that the area where the The orientation of the maximum horizontal stressobserved
observeddata show a rather strong scatter coincides with a from breakout data in 22 wells in south-eastern and western
region, in the model Siz40, where the horizontal stressesare
nearly isotropic (Figure 14). In this area the deformation at Sicilytogetherwith previouslyavailablestressmeasurements
the boundaryand the opening of the Pantelleria Rift leads to [M•illeret al., 1992]allowsus to distinguishseveraltectonic
nearlyequalmagnitudesof SHmax and Shmin (Figure 14). unitswith characteristicstresspatterns.
The main resultsderived from the numerical modeling are The resultsof finite element modeling show that the
the following: diversityof observedstressorientationscan be explained
with a singleNW to NNW orientedfar-field stress,modulated
(1) The observed stress field can be modeled under the
by crustal thickness variations and local sources.The far-field
assumption of a NNW-SSE regional stress field, which is stress is linked to plate tectonic processes,such as the
modulated by the variation of crustal thickness as one
important parameter. The rotation resulting from thickness northwardmotionof major crustalunits locatedalongthe
variation is clockwise in the northeasternpart of Sicily and Africanplatemarginandthe spreadingon the Sicily Strait
Calabria and counterclockwisein westernSicily. Rift Zone.Thelocalstressfieldis modulatedby weakfracture
(2) Material propertiesdue to different rock types do not zones and varying crustal thicknesses.
cause significant stress reorientations. This is in accordance Applyingthe globalquality assignmentable of the World
StressMap, ourbreakoudt atacanberegardedasreliablestress
indicatorsa,ndthuswe contributteo a betterlocalknowledge
Table 4. Boundary Conditionsfor the Models Describedin the Text
Name MohoShape DifferentMaterials Rift Opening Malta Escarpment Figures
Siz36 yes no no no 12
Siz50 yes yes no no 12
Siz35 yes no yes no 12
Siz40 yes yes yes yes
13, 14
All modelscontainthevariationof the Moho depthin comparisonto a plainreferencemodel."Yes"in the differentmaterialscolumnindicatesthat
differentYoung'smoduliandPoisson'sratioshavebeentakeninto accountM. odelswith "yes"in the columnof Malta Escarpmenatccountfor the
Malta Escarpmenats a weak zone."Yes"in the rift openingcolumnmeansthat the PantelleriaRift was modeledby consideringdisplacements
perpendiculatro the rift axis.