
Page 7 - 10.1.1.498.8230
P. 7
Eastern Atlantic and Mediterranean bluefin tuna populations 1305
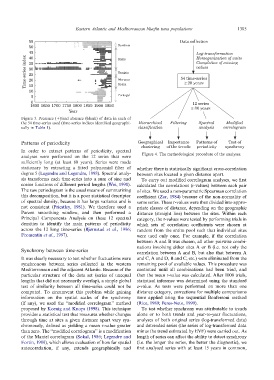
55Time-series index Data collection
50 Sardinia
Log-transformation
45 Homogenization of units
Completion of missing
40 Sicily values
35
54 time-series
30 ≥ 20 years
25 Tunisia
20 Morocco 12 series
15 Spain ≥ 80 years
10 Hierarchical Filtering Spectral Modified
5 Portugal classification analysis correlogram
0
1600 1650 1700 1750 1800 1850 1900 1950
Year
Figure 3. Presence (+)/and absence (blank) of data in each of
the 54 time-series used (time-series indices identified geographi-
cally in Table 1).
Patterns of periodicity Geographical Importance Patterns of Test of
In order to extract patterns of periodicity, spectral clustering of the trends periodicity synchrony
analyses were performed on the 12 series that were
sufficiently long (at least 80 years). Series were made Figure 4. The methodological procedure of the analyses.
stationary by extracting a fitted polynomial filter of
degree 5 (Legendre and Legendre, 1998). Spectral analy- whether there is statistically significant cross-correlation
sis transforms each time-series into a sum of sine and between sites located a given distance apart.
cosine functions of different period lengths (Wei, 1990).
The raw periodogram is the usual means of summarizing To carry out modified correlogram analyses, we first
this decomposition, but it is a poor statistical descriptor calculated the correlations (r-values) between each pair
of spectral density, because it has large variance and is of sites. We used a non-parametric Spearman correlation
not consistent (Priestley, 1981). We therefore used a coefficient (Zar, 1984) because of the non-normality of
Parzen smoothing window, and then performed a some series. These r-values were then divided into appro-
Principal Components Analysis on these 12 spectral priate classes of distance, depending on the geographic
densities to identify the main patterns of periodicity distance (straight line) between the sites. Within each
across the 12 long time-series (Bjørnstad et al., 1996; category, the r-values were tested by performing trials in
Fromentin et al., 1997). which sets of correlation coefficients were chosen at
random from the entire pool such that individual sites
Synchrony between time-series were used only once. For example, if the correlation
between A and B was chosen, all other pairwise combi-
It was clearly necessary to test whether fluctuations were nations involving either sites A or B (i.e. not only the
synchronous between series collected in the western correlation between A and B, but also that between A
Mediterranean and the adjacent Atlantic. Because of the and C, A and D, B and C, etc.) were eliminated from the
particular structure of the data set (series of unequal remaining pool of available values. This procedure was
lengths that did not necessarily overlap), a simple global continued until all combinations had been tried, and
test of similarity between all time-series could not be then the mean r-value was calculated. After 1000 trials,
computed. To circumvent this problem while gaining statistical inference was determined using the standard
information on the spatial scales of the synchrony z-value. As tests were performed on more than one
(if any), we used the ‘‘modified correlogram’’ method distance category, corrections for multiple comparisons
proposed by Koenig and Knops (1998). This technique were applied using the sequential Bonferroni method
provides a statistical test that measures whether changes (Rice, 1989; Peres-Neto, 1999).
through time at sites a given distance apart vary syn-
chronously, defined as yielding a mean r-value greater To test whether synchrony was attributable to trends
than zero. The ‘‘modified correlogram’’ is a modification alone or to both trends and year-to-year fluctuations,
of the Mantel correlogram (Sokal, 1986; Legendre and analyses of both original series (log-transformed data)
Fortin, 1989), which allows evaluation of how far spatial and detrended series (the series of log-transformed data
autocorrelation, if any, extends geographically and minus the trend estimated by EVF) were carried out. As
length of series can affect the ability to detect synchrony
(i.e. the longer the series, the better the diagnostic), we
first analysed series with at least 15 years in common,