
Page 11 - 10.1.1.498.8230
P. 11
Eastern Atlantic and Mediterranean bluefin tuna populations 1309
1 1 1
(a) (b)
0.8 0.8 0.5 **
** ** ** 0.6 ** 0
0.6 0.4 ** 0
Mean r *
0.2 1000 2250
0.4
0.2 0 170 113 22
75 75 55 17 2
320 168 40 0 0 105 166 208 38 –0.2
0 100 200 300 400 500 600 700 800
0 250 500 750 1000 1250 1500 1750 2000 2250
1 1 1
(c) (d)
**
0.8 ** 0.8
0.6 ** ** ** 0.5
0.4 ** * ** 0.6 0
Mean r ** 0.4 ** 0 1000 2250
0.2
0.2 0 34 15 17 25 14 6 11 2 48
57 48 18 0 0 22 11 16 10 –0.2
0 250 500 750 1000 1250 1500 1750 2000 2250 0 100 200 300 400 500 600 700 800
Distance category (km) Distance category (km)
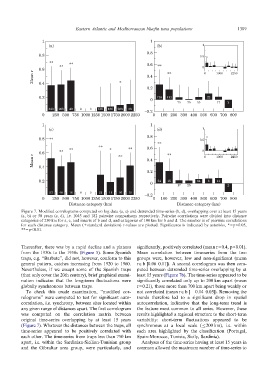
Figure 7. Modified correlograms computed on log data (a, c) and detrended time-series (b, d), overlapping over at least 15 years
(a, b) or 50 years (c, d), i.e. 1045 and 182 pairwise comparisons respectively. Pairwise correlations were divided into distance
categories of 250 km for a, c, and inserts of b and d, and categories of 100 km for b and d. The number is of pairwise correlations
for each distance category. Mean (+standard deviation) r-values are plotted. Significance is indicated by asterisks, *=p<0.05,
** = p<0.01.
Thereafter, there was by a rapid decline and a plateau significantly, positively correlated (mean r=0.4, p<0.01).
from the 1930s to the 1950s (Figure 5). Some Spanish Mean correlation between time-series from the two
traps, e.g. ‘‘Barbate’’, did not, however, conform to this groups were, however, low and non-significant (mean
general pattern, catches increasing from 1920 to 1960. r∈b [0.06–0.11]). A second correlogram was then com-
Nevertheless, if we except some of the Spanish traps puted between detrended time-series overlapping by at
(that only cover the 20th century), brief graphical exami- least 15 years (Figure 7b). The time-series appeared to be
nation indicates that the long-term fluctuations were significantly correlated only up to 200 km apart (mean
globally synchronous between traps. r=0.21), those more than 700 km apart being weakly or
not correlated (mean r∈b [ 0.14–0.05]). Removing the
To check this crude examination, ‘‘modified cor- trends therefore led to a significant drop in spatial
relograms’’ were computed to test for significant auto- autocorrelation, indicative that the long-term trend is
correlation, i.e. synchrony, between sites located within the feature most common to all series. However, these
any given range of distances apart. The first correlogram results highlighted a regional structure to the short-term
was computed on the correlation matrix between variability: short-term fluctuations appeared to be
original time-series overlapping by at least 15 years synchronous at a local scale (c200 km), i.e. within
(Figure 7). Whatever the distances between the traps, all each area highlighted by the classification (Portugal,
time-series appeared to be positively correlated with Spain-Morocco, Tunisia, Sicily, Sardinia).
each other. The time-series from traps less than 750 km
apart, i.e. within the Sardinian-Sicilian-Tunisian group Analyses of the time-series having at least 15 years in
and the Gibraltar area group, were particularly, and common allowed the maximum number of time-series to