
Page 8 - 10.1.1.498.8230
P. 8
1306 C. Ravier and J.-M. Fromentin
(a)
9
7
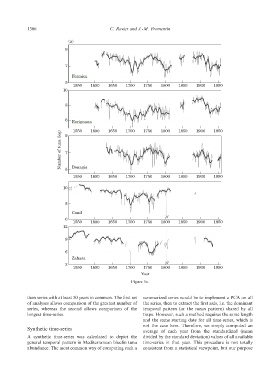
Formica
5 1600 1650 1700 1750 1800 1850 1900 1950
1550
10
8
6 Favignana
Number of tuna (log) 1550 1600 1650 1700 1750 1800 1850 1900 1950
9
7
5 Bonagia 1650 1700 1750 1800 1850 1900 1950
1550 1600
10
5 1600 1650 1700 1750 1800 1850 1900 1950
Conil
0 1550
12
9
6 1650 1700 1750 1800 1850 1900 1950
Zahara Year
3 Figure 5a.
1550 1600
then series with at least 50 years in common. The first set summarized series would be to implement a PCA on all
of analyses allows comparison of the greatest number of the series, then to extract the first axis, i.e. the dominant
series, whereas the second allows comparison of the temporal pattern (or the mean pattern) shared by all
longest time-series. traps. However, such a method requires the same length
and the same starting date for all time-series, which is
Synthetic time-series not the case here. Therefore, we simply computed an
average of each year from the standardized (mean
A synthetic time-series was calculated to depict the divided by the standard deviation) values of all available
general temporal pattern in Mediterranean bluefin tuna time-series in that year. This procedure is not totally
abundance. The most common way of computing such a consistent from a statistical viewpoint, but our purpose