
Page 13 - 10.1.1.498.8230
P. 13
Eastern Atlantic and Mediterranean bluefin tuna populations 1311
2
Mean of standardized number of tuna 1
0
–1
–2
1650 1700 1750 1800 1850 1900 1950
Year
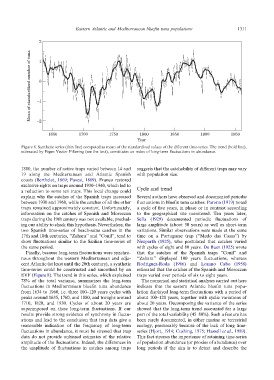
Figure 8. Synthetic series (thin line) computed as mean of the standardized values of the different time-series. The trend (bold line),
estimated by Eigen Vector Filtering (see the text), constitutes an index of long-term fluctuations in abundance.
1880, the number of active traps varied between 14 and suggests that the catchability of different traps may vary
19 along the Mediterranean and Atlantic Spanish with population size.
coasts (Berthelot, 1869; Pavesi, 1889). Franco restored
exclusive rights on traps around 1930–1940, which led to Cycle and trend
a reduction to some ten traps. This local change could
explain why the catches of the Spanish traps increased Several authors have observed and documented periodic
between 1930 and 1960, while the catches of all the other fluctuations in bluefin tuna catches. Parona (1919) noted
traps remained approximately constant. Unfortunately, a cycle of five years, in phase or in contrast according
information on the catches of Spanish and Moroccan to the geographical site monitored. Ten years later,
traps during the 19th century was not available, preclud- Sella (1929) documented periodic fluctuations of
ing our ability to check this hypothesis. Nevertheless, the large amplitude (about 50 years) as well as short-term
two Spanish time-series of beach-seine catches in the variations. Similar observations were made at the same
17th and 18th centuries, ‘‘Zahara’’ and ‘‘Conil’’, tend to time on a Portuguese trap (‘‘Medo das Casas’’) by
show fluctuations similar to the Sicilian time-series of Neuparth (1925), who postulated that catches varied
the same period. with cycles of eight and 80 years. De Buen (1925) wrote
that the catches of the Spanish traps ‘‘Conil’’ and
Finally, because long-term fluctuations were synchro- ‘‘Zahara’’ displayed 100 years fluctuations, whereas
nous throughout the western Mediterranean and adja- Rodriguez-Roda (1966) and Lozano Cabo (1958)
cent Atlantic (at least until the 20th century), a synthetic estimated that the catches of the Spanish and Moroccan
time-series could be constructed and smoothed by an traps varied over periods of six to eight years.
EVF (Figure 8). The trend in this series, which explained
78% of the total variance, summarizes the long-term The numerical and statistical analyses carried out here
fluctuations in Mediterranean bluefin tuna abundance indicate that the eastern Atlantic bluefin tuna popu-
from 1634 to 1960, i.e. three 100–120 years cycles with lation displayed long-term fluctuations with a period of
peaks around 1635, 1760, and 1880, and troughs around about 100–120 years, together with cyclic variations of
1710, 1820, and 1930. Cycles of about 20 years are about 20 years. Decomposing the variance of the series
superimposed on these long-term fluctuations. If our showed that the long-term trend accounted for a large
results provide strong evidence of synchrony in fluctu- part of the total variability (45–80%). Such a feature has
ations and lead to the conclusion that trap data give a been rarely documented, in either marine or terrestrial
reasonable indication of the frequency of long-term ecology, presumably because of the lack of long time-
fluctuations in abundance, it must be stressed that trap series (Hjort, 1914; Cushing, 1975; Hassell et al., 1989).
data do not provide unbiased estimates of the relative This fact stresses the importance of retaining time-series
amplitude of the fluctuations. Indeed, the differences in of population abundance (or proxies of abundance) over
the amplitude of fluctuations in catches among traps long periods if the aim is to detect and describe the