
Page 10 - 10.1.1.498.8230
P. 10
1308 C. Ravier and J.-M. Fromentin
Tunisia, Sicily and Sardinia (Table 1). These five Row scores8
areas were gathered within two main areas, the area
around Gibraltar, and the eastern end of the western 4
Mediterranean. The most productive traps were on the
southern coasts of Spain and Portugal (Figure 1). They 0
caught 4300 tuna per year (median value). The most
productive trap was ‘‘Barbate’’ which caught about –4
16 000 tuna annually, and the least productive was 0 0.05 0.1 0.15 0.2 0.25 0.3 0.35 0.4 0.45 0.5
‘‘Ramalhete’’, which caught about 1100 bluefin tuna Frequency (year–1)
annually. Some traps at the eastern end of the western
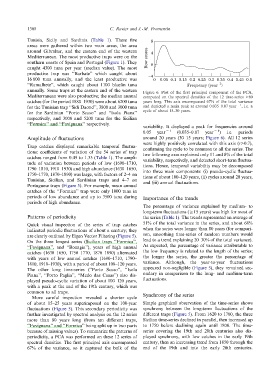
Mediterranean were also productive; the median annual Figure 6. Plot of the first principal component of the PCA,
catches (for the period 1880–1930) were about 6200 tuna computed on the spectral densities of the 12 time-series >80
for the Tunisian trap ‘‘Sidi Daoud’’, 3800 and 3000 tuna years long. This axis encompassed 67% of the total variance
for the Sardinian ‘‘Porto Scuso’’ and ‘‘Isola Piana’’ and depicted a main peak at around 0.035–0.07 year 1, i.e. a
respectively, and 3000 and 5200 tuna for the Sicilian cycle of about 15–30 years.
‘‘Formica’’ and ‘‘Favignana’’ respectively.
variability. It displayed a peak for frequencies around
Amplitude of fluctuations 0.05 year 1 (0.035–0.07 year 1) i.e. periods
around 20 years (30–15 years; Figure 6). All 12 series
Trap catches displayed remarkable temporal fluctua- were highly positively correlated with this axis (r>0.7),
tions: coefficients of variation of the 54 series of trap confirming the cycle to be common to all the series. The
catches ranged from 0.49 to 1.33 (Table 1). The ampli- two following axes explained only 11 and 8% of the total
tude of variation between periods of low (1690–1710, variability, respectively, and detected short-term fluctua-
1790–1810, 1910–1930) and high abundance (1630–1650, tions. Hence, temporal variability may be decomposed
1750–1770, 1870–1890) was large, with factors of 2–4 on into three main components: (i) pseudo-cyclic fluctua-
Tunisian, Sicilian, and Sardinian traps and 4–7 on tions of about 100–120 years, (ii) cycles around 20 years,
Portuguese traps (Figure 5). For example, mean annual and (iii) annual fluctuations.
catches of the ‘‘Formica’’ trap were only 1000 tuna in
periods of low abundance and up to 3500 tuna during Importance of the trends
periods of high abundance.
The percentage of variance explained by medium- to
Patterns of periodicity long-term fluctuations (d15 years) was high for most of
the series (Table 1). The trends represented an average of
Quick visual inspection of the series of trap catches 51% of the total variance in the series, and about 68%
indicated periodic fluctuations of about a century; they when the series were longer than 80 years (for compari-
are clearly outlined by Eigen Vector Filtering (Figure 5). son, smoothing time-series of random numbers would
On the three longest series (Sicilian traps ‘‘Formica’’, lead to a trend explaining 20–30% of the total variance).
‘‘Favignana’’, and ‘‘Bonagia’’), years of high annual As expected, the percentage of variance attributable to
catches (1630–1650, 1750–1770, 1870–1890) alternated the low frequency is related to the length of the series;
with years of low annual catches (1690–1710, 1790– the longer the series, the greater the percentage of
1810, 1910–1930), with a period of about 100–120 years. variance. Although, the year-to-year fluctuations
The other long time-series (‘‘Porto Scuso’’, ‘‘Isola appeared non-negligible (Figure 5), they remained sec-
Piana’’, ‘‘Porto Paglia’’, ‘‘Medo das Casas’’) also dis- ondary in comparison to the long- and medium-term
played pseudo-cyclic variation of about 100–120 years, fluctuations.
with a peak at the end of the 19th century, which was
common to all traps. Synchrony of the series
More careful inspection revealed a shorter cycle Simple graphical observation of the time-series shows
of about 15–25 years superimposed on the 100-year synchrony between the long-term fluctuations of the
fluctuations (Figure 5). This secondary periodicity was different traps (Figure 5). From 1620 to 1700, the three
further investigated by spectral analysis on the 12 series Sicilian time-series declined in parallel, then increased up
more than 80 years long (from ten different traps, to 1750 before declining again until 1800. The time-
‘‘Favignana’’ and ‘‘Formica’’ being split up in two parts series covering the 19th and 20th centuries also dis-
because of missing values). To summarize the patterns of played synchrony, with low catches in the early 19th
periodicity, a PCA was performed on these 12 series of century, then an increasing trend from 1850 through the
spectral densities. The first principal axis encompassed end of the 19th and into the early 20th centuries.
67% of the variance, so it captured the bulk of the