
Page 3 - 4022883
P. 3
BIOLOGICAL CONSERVATION 141 (2008) 699–709 701
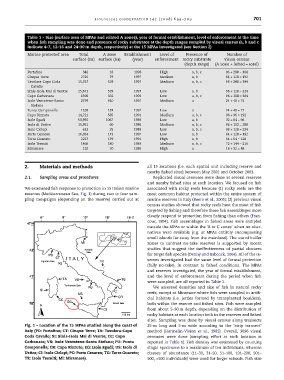
Table 1 – Size (surface area of MPAs and related A zones), year of formal establishment, level of enforcement at the time
when fish sampling was done and presence of rocky substrates at the depth ranges sampled by visual census (a, b and c
indicate 4–7, 12–16 and 24–30 m depth, respectively) at the 15 MPAs investigated (see Section 2)
Marine protected area Total A zone Establishment Level of Presence of Number of
surface (ha) surface (ha) (year) enforcement rocky substrate visual census
(depth range) (A zone + fished = total)
Portofino 346 18 1998 High a, b, c 96 + 288 = 384
Cinque Terre 2726 79 1997 Medium a, b 64 + 128 = 192
Tavolara-Capo Coda 15,357 529 1997 Medium a, b, c 96 + 288 = 384
Cavallo 25,673 529 1997 Low a, b 96 + 128 = 224
Sinis-Isola Mal di Ventre 8598 332 1999 Low a, b, c 96 + 288 = 384
Capo Carbonara 2799 410 1997 Medium a 24 + 48 = 72
Isole Ventotene-Santo
1539 181 1997 Low a 24 + 48 = 72
Stefano 14,721 585 1991 Medium a, b, c 96 + 96 = 192
Punta Campanella 53,992 1067 1989 Low a, b 32 + 64 = 96
Capo Rizzuto 15,951 1986 Medium a, b, c 96 + 192 = 288
Isole Egadi 60 1989 Low a, b, c 96 + 128 = 224
Isola di Ustica 623 35 1997 Low a, b 64 + 128 = 192
Isole Ciclopi 16,654 173 1991 High a, b 64 + 64 = 128
Porto Cesareo 179 1989 Medium a, b, c 72 + 144 = 216
Torre Guaceto 2227 180 1986 High a 16 + 32 = 48
Isole Tremiti 1466 30
Miramare
120
2. Materials and methods all 15 locations (i.e. each spatial unit including reserve and
2.1. Sampling areas and procedures nearby fished sites) between May 2002 and October 2003.
We examined fish response to protection in 15 Italian marine Replicated visual censuses were done at several reserves
reserves (Mediterranean Sea; Fig. 1) during two to four sam- and nearby fished sites at each location. We focused on fish
pling campaigns (depending on the reserve) carried out at associated with rocky reefs because (1) rocky reefs are the
most common habitat protected within the entire system of
Fig. 1 – Location of the 15 MPAs studied along the coast of marine reserves in Italy (Boero et al., 2005); (2) previous visual
Italy (PO: Portofino; CT: Cinque Terre; TA: Tavolara-Capo census studies showed that rocky reefs host the most of fish
Coda Cavallo; SI: Sinis-Isola Mal di Ventre; CC: Capo targeted by fishing and therefore these fish assemblages more
Carbonara; VS: Isole Ventotene-Santo Stefano; PU: Punta clearly respond to protection from fishing than others (Fran-
Campanella; CR: Capo Rizzuto; EG: Isole Egadi; US: Isola di cour, 1994). Fish assemblages in fished areas were sampled
Ustica; CI: Isole Ciclopi; PC: Porto Cesareo; TG: Torre Guaceto; outside the MPAs or within the ‘B or C zones’ when no alter-
TR: Isole Tremiti; MI: Miramare). natives were available (e.g. at MPAs entirely encompassing
small islands far away from the mainland). The use of buffer
zones to contrast no-take reserves is supported by recent
studies that suggest the ineffectiveness of partial closures
for target fish species (Denny and Babcock, 2004). All of the re-
serves investigated had the same level of formal protection
(fully no-take), in contrast to fished conditions. The MPAs
and reserves investigated, the year of formal establishment,
and the level of enforcement during the period when fish
were sampled, are all reported in Table 1.
We assessed densities and size of fish in natural rocky
reefs, except at Miramare where fish were sampled in artifi-
cial habitats (i.e. jetties formed by transplanted boulders),
both within the reserve and fished sites. Fish were sampled
from about 5–30 m depth, depending on the distribution of
rocky habitats at each location both in the reserves and fished
sites. Sampling was done by visual census along transects
25-m long and 5-m wide according to the ‘strip transect’
method (Harmelin-Vivien et al., 1985). Overall, 3096 visual
censuses were done (sampling effort at each location is
reported in Table 1). Fish density was estimated by counting
single specimens to a maximum of ten individuals, whereas
classes of abundance (11–30, 31–50, 51–100, 101–200, 201–
500, >500 individuals) were used for larger schools. Fish size