
Page 5 - 4022883
P. 5
BIOLOGICAL CONSERVATION 141 (2008) 699–709 703
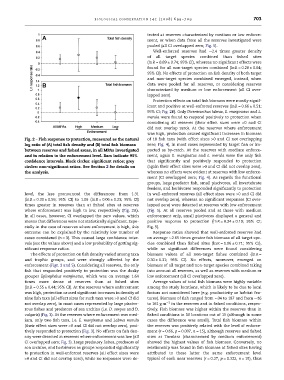
Fig. 2 – Fish response to protection, measured as the natural tected at reserves characterized by medium or low enforce-
log ratio of (A) total fish density and (B) total fish biomass ment, or when data from all the reserves investigated were
between reserves and fished areas, in all MPAs investigated pooled (all CI overlapped zero; Fig. 5).
and in relation to the enforcement level. Bars indicate 95%
confidence intervals. Black circles: significant ratios; grey Well-enforced reserves had $2.4 times greater density
circles: non-significant ratios. See Section 2 for details on of all target species combined than fished sites
the analysis. (ln R = 0.89 ± 0.74; 95% CI), whereas no significant effects were
found for all non-target species combined (ln R = 0.28 ± 0.64;
level, the less pronounced the differences: from 1.31 95% CI). No effects of protection on fish density of both target
(ln R = 0.30 ± 0.56; 95% CI) to 1.06 (ln R = 0.06 ± 0.23; 95% CI) and non-target species combined emerged, instead, when
times greater in reserves than at fished sites at reserves data were pooled for all reserves, or considering reserves
where enforcement was high to low, respectively (Fig. 2A). characterized by medium or low enforcement (all CI over-
In all cases, however, CI overlapped the zero values, which lapped zero).
means that differences were not statistically significant. Espe-
cially in the case of reserves where enforcement is high, this Protection effects on total fish biomass were mostly signif-
outcome can be explained by the relatively low number of icant and positive at well-enforced reserves (ln R = 0.66 ± 0.51;
cases considered (n = 3). This caused large confidence inter- 95% CI; Fig. 2B). Only Dicentrarchus labrax, E. marginatus and L.
vals (see the values above) and a low probability of getting sig- merula were found to respond positively to protection when
nificant response ratios. considering all reserves (their effect sizes were >0 and CI
did not overlap zero). At the reserves where enforcement
The effects of protection on fish density varied among taxa was high, protection caused significant increases in biomass
and trophic groups, and were strongly affected by the of 18 fish taxa (with effect sizes >0 and CI not overlapping
enforcement (Figs. 3 and 5). Considering all reserves, the only zero; Fig. 4), in most cases represented by target fish or im-
fish that responded positively to protection was the dusky pacted as by-catch. At the reserves with medium enforce-
grouper Epinephelus marginatus, which was on average 1.64 ment, again E. marginatus and L. merula were the only fish
times more dense at reserves than at fished sites that significantly and positively responded to protection
(ln R = 0.55 ± 0.44; 95% CI). At the reserves where enforcement (again their effect sizes were >0 and CI did not overlap zero),
was high, protection caused significant increases in density of whereas no effects were evident at reserves with low enforce-
nine fish taxa (all effect sizes for such taxa were >0 and CI did ment (CI overlapped zero; Fig. 4). As regards the functional
not overlap zero), in most cases represented by large piscivo- groups, large predator fish, small piscivores, all invertebrate
rous fishes and predators of sea urchins (i.e. D. sargus and D. feeders, and herbivores responded significantly to protection
vulgaris) (Fig. 3). At the reserves where enforcement was med- in well-enforced reserves (all effect sizes were >0 and CI did
ium, only two fish taxa, i.e. E. marginatus and Labrus merula not overlap zero), whereas no significant responses (CI over-
(their effect sizes were >0 and CI did not overlap zero), posi- lapped zero) were detected at reserves with low enforcement
tively responded to protection (Fig. 3). No effects on fish den- (Fig. 5). At all reserves pooled and at those with medium
sity were detected at reserves where enforcement was low (all enforcement only, small piscivores displayed a general and
CI overlapped zero; Fig. 3). Large predatory fishes, predators of positive response to protection (ln R = 0.24 ± 0.19; 95% CI;
sea urchins, and herbivores as groups responded significantly Fig. 5).
to protection in well-enforced reserves (all effect sizes were
>0 and CI did not overlap zero), while no responses were de- Response ratios showed that well-enforced reserves had
on average $2.65 times greater fish biomass of all target spe-
cies combined than fished sites (ln R = 1.06 ± 0.71; 95% CI),
while no significant differences were found considering
biomass values of all non-target fishes combined (ln R =
0.30 ± 0.31; 95% CI). No effects, moreover, emerged on
biomass of all target and non-target species combined taking
into account all reserves, as well as reserves with medium or
low enforcement (all CI overlapped zero).
Average values of total fish biomass were highly variable
among the study locations, which is likely to be due to local
factors not considered here (e.g. productivity or habitat fea-
tures). Biomass of fish ranged from $34 to 187 and from $16
to 161 g mÀ2 in the reserves and in fished conditions, respec-
tively. Fish biomass was higher within the reserves than in
fished conditions in 10 locations out of 15 (although in some
cases the difference was small). Total fish biomass within
the reserves was positively related with the level of enforce-
ment (r = 0.66, p = 0.007, n = 15), although reserves and fished
sites at Tavolara (characterized by medium enforcement)
showed the highest values of fish biomass. Conversely, no
relationship was found in fish biomass at fished sites having
attributed to these latter the same enforcement level
typical of each near reserves (r = 0.27, p = 0.322, n = 15), thus