
Page 8 - 4022883
P. 8
706 BIOLOGICAL CONSERVATION 141 (2008) 699–709
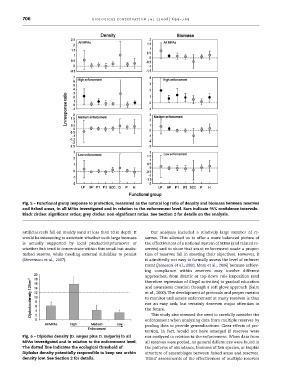
Fig. 5 – Functional group response to protection, measured as the natural log ratio of density and biomass between reserves
and fished areas, in all MPAs investigated and in relation to the enforcement level. Bars indicate 95% confidence intervals.
Black circles: significant ratios; grey circles: non-significant ratios. See Section 2 for details on the analysis.
artificial reefs fall on muddy sand at less than 10 m depth. It Our analyses included a relatively large number of re-
would be interesting to ascertain whether such large biomass serves. This allowed us to offer a more balanced picture of
is actually supported by local productivity/turnover or the effectiveness of a national system of MPAs (and related re-
whether fish tend to concentrate within this small but undis- serves) and to show that scant enforcement made a propor-
turbed reserve, while needing external subsidies to persist tion of reserves fail in meeting their objectives. However, it
(Stevenson et al., 2007). is admittedly not easy to formally assess the level of enforce-
ment (Jameson et al., 2000; Mora et al., 2006) because achiev-
Fig. 6 – Diplodus density (D. sargus plus D. vulgaris) in all ing compliance within reserves may involve different
MPAs investigated and in relation to the enforcement level. approaches, from drastic or top-down rule imposition (and
The dotted line indicates the ecological threshold of therefore repression of illegal activities) to gradual education
Diplodus density potentially responsible to keep sea urchin and awareness creation through a soft glove approach (Salm
density low. See Section 2 for details. et al., 2000). The development of protocols and proper metrics
to monitor and assess enforcement at many reserves is thus
not an easy task, but certainly deserves major attention in
the future.
This study also stressed the need to carefully consider the
enforcement when analyzing data from multiple reserves by
pooling data to provide generalizations. Clear effects of pro-
tection, in fact, would not have emerged if reserves were
not analyzed in relation to the enforcement. When data from
all reserves were pooled, no general differences were found in
the patterns of abundance, biomass of fish species, or trophic
structure of assemblages between fished areas and reserves.
‘Blind’ assessments of the effectiveness of multiple reserves