
Page 21 - Asylv_molars_Pmax_revised_2014_01
P. 21
21
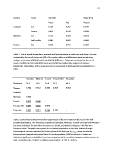
Locality
Factor
Size
(A0)
Shape
(FCs)
PANOVA
PKW
PMANOVA
Lantabat
Sex
0.189
0.267
0.2792
Season
0.822
0.819
0.6305
Mimizan
Sex
0.128
0.099
0.9528
Sub-‐locality
0.001
0.003
0.0603
Tourch
Sex
0.746
0.991
0.1042
Table
2.
Test
of
sexual
dimorphism,
seasonal
and
local
variations
in
molar
size
and
shape.
Size
was
estimated
by
the
zeroth
harmonic
(A0)
of
the
molar
outline
and
differences
were
tested
using
analyses
of
variance
(ANOVA)
and
Kruskal-‐Wallis
(KW)
tests.
Shape
was
estimated
by
the
set
of
Fourier
coefficients
(FCs)
and
differences
were
tested
by
multivariate
analyses
of
variance
(MANOVA).
Probabilities
of
the
respective
tests
are
provided.
In
bold
significant
probabilities
(P
<
0.05).
Lantabat
Mimizan
Tourch
Porquerolles
Tarquinia
%variance
51.1
32.0
36.8
29.3
49.2
Rbootstrap
0.982
0.962
0.980
0.909
0.969
Lantabat
-‐
Mimizan
0.950
-‐
Tourch
0.973
0.942
-‐
Porquerolles
0.867
0.872
0.846
-‐
Tarquinia
0.952
0.911
0.966
0.752
-‐
Table
3.
Correlation
between
Pmax
(first
eigenvector
of
the
VCV
matrix
on
the
FCs)
in
five
well-‐
sampled
populations.
The
first
three
populations
(Lantabat,
Mimizan,
Tourch)
correspond
to
Western
European
mainland.
Porquerolles
documents
an
insular
population
belonging
to
the
Western
European
clade.
Tarquinia
corresponds
to
a
mainland
population
of
the
italo-‐balkanic
lineage.
Percentage
of
variance
explained
by
Pmax
is
given
in
the
first
row.
Rbootstrap,
mean
correlation
between
bootstrapped
and
original
Pmax
for
each
population
(100
bootstraps).
R
values
are
indicated,
significant
probabilities
based
on
comparison
with
correlation
between
random
vectors
in
bold
+
underlined
(R
=
0.860,
P
<
0.0001)
and
in
bold
(R
=
0.770,
P
<
0.001).
