
Page 23 - Asylv_molars_Pmax_revised_2014_01
P. 23
23
Rbootstrap/original
Pmax
Allom-‐intra
LANT
MIM
TOU
TARQ
PORQ
MIM
TOU
FR-‐SEPORQ
0.909
0.852
0.908
0.881
0.858
-‐0.399
-‐0.336
IT-‐CWSARD
0.976
0.169
0.360
0.178
0.145
0.165
-‐0.559
-‐0.418
FR-‐WOLER
0.909
0.843
0.775
0.893
0.792
0.800
-‐0.374
-‐0.562
FR-‐WRE
0.986
0.766
0.716
0.847
0.738
0.785
-‐0.242
-‐0.438
ITSIC
0.966
-‐0.869
-‐0.847
-‐0.886
-‐0.896
-‐0.617
0.485
0.262
0.921
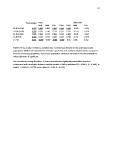
Table
6.
Pmax,
insular
evolution,
and
allometry.
Evolutionary
divergence
characterizing
insular
populations
(differences
between
FCs
of
insular
specimens
and
mainland
relatives)
were
compared
to
Pmax
of
several
populations,
and
to
intra-‐population
allometric
direction
in
the
two
populations
where
allometry
is
significant.
For
correlations
among
directions,
R
values
are
indicated,
significant
probabilities
based
on
comparison
with
correlation
between
random
vectors
in
bold
+
underlined
(P
<
0.0001,
R
=
0.
860),
in
bold
(P
<
0.001,
R
=
0.770)
and
in
italics
(P
<
0.01,
R
=
0.651).
