
Page 22 - Asylv_molars_Pmax_revised_2014_01
P. 22
22
Rboostrap
Pmax
Evolution
LANT
MIM
TOU
TARQ
PORQ
V1mainland
WEURIT
NEWF
V1mainland
-‐0.782
-‐0.655
-‐0.828
-‐0.833
-‐0.619
WEURIT
0.772
0.520
0.390
0.606
0.622
0.438
-‐
0.975
-‐0.883
-‐
NEFR-‐W
0.957
-‐0.581
-‐0.503
-‐0.683
-‐0.607
-‐0.510
0.856
-‐0.830
-‐
CONT/Latitude
0.976
-‐0.802
-‐0.654
-‐0.804
-‐0.802
-‐0.694
0.938
-‐0.794
0.767
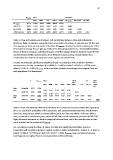
Table
4.
Pmax
and
evolutionary
directions.
Left,
correlations
between
Pmax
and
evolutionary
directions.
Right,
correlations
among
directions
of
evolution.
Directions
of
evolution
are:
(1)
first
axis
of
intergroup
variation
among
mainland
localities
(V1mainland,
calculated
as
the
first
eigenvector
of
the
VCV
matrix
on
average
FCs
per
groups,
30.6%
of
the
inter-‐group
variance;
N
=
33).
(2)
Differentiation
between
Western
European
and
Italian
lineages.
(3)
Differentiation
between
Western
France
(FR-‐W)
and
North-‐Eastern
(NE)
representatives
of
the
Western
European
group.
(4)
Latitudinal
trend,
estimated
by
the
multivariate
regression
of
FCs
against
latitude
(N=413).
R
values
are
indicated,
significant
probabilities
based
on
comparison
with
correlation
between
random
vectors
in
bold
+
underlined
(P
<
0.0001,
R
=
0.
860),
in
bold
(P
<
0.001,
R
=
0.770)
and
in
italics
(P
<
0.01,
R
=
0.651).
Rbootstrap,
mean
correlation
between
bootstrapped
and
original
Pmax
for
each
population
(100
bootstraps).
P
Rbootstrap
Pmax
Allom-‐
V1
Allom-‐
intra
TOU
V1mainland
inter
AllomMIM
LANT
MIM
TOU
TARQ
PORQ
MIM
AllomTOU
0.013
0.799
CONT-‐
Allom-‐ CONT-‐GM
0.001
0.822
-‐ -‐ -‐ -‐ -‐ -‐
-‐
GM
intra
<0.001
0.901
0.462
0.551
0.500
0.495
0.320
0.403
-‐0.815
0.561
-‐ -‐ -‐ -‐ -‐
Allom-‐ 0.485
0.484
0.471
0.384
0.573
0.304
-‐
inter
0.414
0.299
0.448
0.532
0.282
CONT-‐Tot
<0.001
0.953
0.216
0.113
0.257
0.279
0.204
0.652
0.485
-‐0.707
0.901
Table
5.
Pmax
and
allometry.
Allometric
directions
were
calculated
based
on
multivariate
regressions
of
FCs
vs.
size
(A0)
(P:
probability
of
the
regression).
Left,
comparison
between
Pmax
and
allometric
directions,
being
intra-‐population
estimate
(Allom-‐intra),
and
inter-‐populations
estimates
(Allom-‐
inter;
estimated
on
continental
group
means
(CONT-‐GM)
and
all
continental
specimens
(CONT-‐TOT).
Rigth,
allometric
directions
are
further
compared
between
them,
and
to
the
main
direction
of
inter-‐
group
variation
on
the
continent
(V1mainland).
For
correlations
among
directions,
R
values
are
indicated,
significant
probabilities
based
on
comparison
with
correlation
between
random
vectors
in
bold
+
underlined
(P
<
0.0001,
R
=
0.
860),
in
bold
(P
<
0.001,
R
=
0.770)
and
in
italics
(P
<
0.01,
R
=
0.651).
Rbootstrap,
mean
correlation
between
bootstrapped
and
original
Pmax
for
each
population
(100
bootstraps).
