
Page 19 - BORSELLINO2006
P. 19
Fishery management in the Channel of Sicily 429
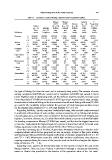
Table 13. Economic acconts of fishing companies under examination (2003).
Indicators Trapani Marsala Mazara Mazara Sciacca Sciacca P.
(n = 4) (n = 9) del V. del V. (n = 9) (n = 6) Empedocle
Purse Longlines (n = 16) (n = 11) Bottom (n = 11)
seines Bottom Gillnets Mid-
otter and otter water Bottom
trawls pots trawls pair otter
trawls trawls
Revenue x¯ 265 042 184 878 347 764 13 586 154 000 141 667 138 955
S 267 078 132 735 97 141 2839 14 465 6831 18 364
CV 1.01 0.72 0.28 0.21 0.09 0.05 0.13
Various x¯ 32 399 42 756 130 863 1073 42 933 30 933 41 973
costs S 20 270 29 575 37 604 356 5306 1944 5185
CV 0.63 0.69 0.29 0.33 0.12 0.06 0.12
Of which x¯ 19 427 24 972 82 680 878 33 433 23 700 35 141
fuel S 14 028 19 922 21 678 300 4197 410 5067
CV 0.72 0.8 0.26 0.34 0.13 0.02 0.14
Depreciation x¯ 45 649 24 272 29 828 163 14 217 11 765 8864
costs S 65 427 25 957 18 657 213 3515 1129 1414
CV 1.43 1.07 0.63 1.3 0.25 0.1 0.16
Maintenance x¯ 21 922 5954 15 448 151 4282 7658 5095
costs S 38 038 11 176 8242 117 496 1316 863
CV 1.74 1.88 0.53 0.78 0.12 0.17 0.17
Labour x¯ 115 378 61 074 113 239 0 59 756 56 667 46 551
costs S 95 921 36 674 35 825 0 8156 2733 6508
CV 0.83 0.6 0.32 0 0.14 0.05 0.14
Value added x¯ 165 071 111 896 171 625 12 199 92 568 91 310 83 023
S 144 723 69 377 50 172 2754 11 288 5056 12 875
CV 0.88 0.62 0.29 0.23 0.12 0.06 0.16
Net income x¯ 49 694 50 822 58 386 12 199 32 812 34 643 36 471
S 49 254 33 963 20 938 2754 5347 2394 6469
CV 0.99 0.67 0.36 0.23 0.16 0.07 0.18
the type of fishing (far from the coast and at extremely deep water). The revenue of purse
seining companies (¤265 042 per vessel) and of longliners (¤184 878 per vessel) is much
lower. Slightly lower, in decreasing order, are the revenues made by trawlers in Sciacca and
Porto Empedocle (¤154 000 per vessel and ¤138 955 per vessel, respectively). Lastly, strongly
characteristic of artisanal fishing are the low revenues of small-scale fishing in Mazara (¤13 586
per vessel). The variability indices indicate the presence of fairly homogenous data, except
for the samples from Trapani (CV = 1.01) and Marsala (CV = 0.72).
Regarding liabilities, ‘sundry expenses’ includes fuel costs, other variable costs connected
to production (the purchase of nets, cordage, various accessories, etc.), trading costs (crates,
ice, packaging, etc.), and other costs connected to the boat (expenses for book keeping, pay
registers, insurance, licenses, etc.). It should be noted that these costs are considerably higher
for trawling companies in Mazara (¤130 863 per vessel), and this has the biggest impact on
net income. Undoubtedly the highest figure for expenses is that of fuel which, for small-scale
fishing, represents nearly the whole amount (¤878 of the ¤1073 per vessel).
Given the increasing age of the fleet, depreciation allowances (which are included in the
company balance sheets for tax purposes) are low on average. In spite of this, purse seining
and small-scale fishing exhibit the highest coefficients of variation (respectively CV = 1.43
and CV = 1.30). Maintenance costs also exhibit high variation coefficients, since these are
ongoing expenses during the course of the year for work on the hull and engine (the highest
being in Marsala; CV = 1.8).
Regarding costs, salaries are the heaviest drain on net income, except in the case of the
Mazara trawlers. Here, the cost of labour is determined through a contractual relationship
based on ‘shares’ that provides for the division of the equivalent value of the ‘net catch’