
Page 16 - BORSELLINO2006
P. 16
426 V. Borsellino et al.
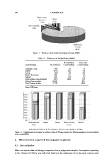
Figure 3. Tunisian vessels divided by fishing technique (2003).
Table 11. Fishermen on Tunisian fishery (2003).
% of northern % on total
Governorships No. fishermen Governorships Governorships
Jendouba e Beja 809 8.4 1.5
Bizerte 4813 50.2 9.0
Ariana 223 2.3 0.4
Tunis e Ben Arous 1291 13.5 2.4
Nabeul 2461 25.6 4.6
Total northern Governorships 9597 100.0 17.9
Others Governorships 43 941 82.1
Total Tunisian fishers 53 538 100.0
Source: ICE Tunisi.
Figure 4. Employment percentages according to type of fishing, amongst the fishing population of governorships
in the north (2003).
4. Micro-economic analysis of the companies in question
4.1 Data collection
Micro-economic data on fishing companies from a judgement sample of companies operating
in the Channel of Sicily was collected thanks to the assistance of on-the-spot experts, such