
Page 5 - Bacci_Pagoto_etali_2015
P. 5
Author's personal copy
Ann Microbiol (2015) 65:1–13 3
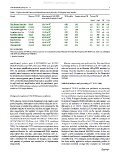
Table 1 Physico-chemical features and bacterial community diversity of Favignana sandy beaches
Sample Mean no. T-RFs a Mean bacterial 16S rRNA % Humidity Organic carbon (%) Texture (%)
gene copies (copies/g of sand) a
Gravel Sand Silt Clay
Lido Burrone shore-line 9.0±0 3.9±1.2x10 4 0.26 5.93 n.d. 97.9 2.0 n.d.
Lido Burrone mid-line 6.7±0.6 1.7±0.4x10 4 0.02 5.79 n.d. 99.5 0.5 n.d.
Lido Burrone upper-line 6.7±1.5 1.2±1.1x10 4 0.1 5.90 0.3 97.6 2.0 0.1
Faraglioni shore-line 9.7±0.6 1.3±0.6x10 5 0.20 9.76 1.0 99.0 n.d. n.d.
Faraglioni mid-line 7.0±0 7.6±1.5x10 4 0.02 8.96 n.d. 100 n.d. n.d.
Faraglioni upper-line 5.7±0.6 6.9±0.8x10 4 0.04 8.52 n.d. 100 n.d. n.d.
Praja shore-line 8.7±0.6 4.6±1.1x10 4 0.18 6.56 10.8 87.4 1.8 0.1
Praja mid-line 7.0±0.6 3.2±0.3x10 4 0.03 7.14 n.d. 98.5 1.4 0.1
Praja upper-line 4.7±1.0 3.4±0.5x10 4 0.01 6.76 0.3 97.8 1.9 0.1
N.d. not detectable
a
The mean number of T-RFs are shown as a proxy of community diversity (ribotypic diversity). Mean bacterial 16S rRNA gene copies are calculated
with qPCR (see Material and Methods)
±, standard deviation
pmoA/amoA, primer pairs A189F/A682R and A189F/ Massive sequencing was performed by Illumina-Solexa
mb661R (Bourne et al. 2001;Horzet al. 2005) were used with technology (Gloor et al. 2010; Bartram et al. 2011)withthe
the two-steps amplification protocol reported in Horz et al. pair-end protocol on an Illumina HiSeq2000 machine by
2005. In particular, A189F/mb661R primer pair specifically Beijing Genome Institute sequencing service (www.
amplify pmoA sequences and not amoA sequences, allowing genomics.cn/). Sequences are deposited in the Bioproject
for discrimination between methane monooxygenase and am- database (http://www.ncbi.nlm.nih.gov/bioproject/)with ID:
monia monooxygenase genes (Bourne et al. 2001). Genomic 234346.
DNA of Sinorhizobium meliloti was used as a positive control
for nifH and nosZ amplification, while for pmoA/amoA geno- Statistical analyses and processing of T-RFLP data
mic DNA of Nitrosomonas europaea was included as a positive
control in PCR amplification. Analysis of T-RFLP profiles was performed as previously
reported (Pini et al. 2012). Statistical analyses were performed
on a binary matrix obtained by linearly combining data from
Metagenetic analysis of 16S rRNA gene amplicons the two restriction enzymes as previously reported (Mengoni
et al. 2009). Ribotypic diversity, as the number of Terminal
DNA aliquots extracted from Faraglioni beach samples were Restriction Fragments (T-RFs) identified in each sample, was
pooled together, with respect to the position along the sea-to- used as an estimator of richness as reported previously
land transect to obtain three samples, each composed by the (Mengoni et al. 2009). Cluster (UPGMA) analysis and
triplicate samples of shore-line, mid-line and upper-line sam- Canonical Correlation Analysis (CCA) were done with Past
ples, respectively. The variable V3 region of the 16S rRNA software (Hammer et al. 2001) on the Jaccard similarity
gene pool of total bacterial community was amplified from matrix obtained from binary T-RFLP profiles. To test the
each sample DNA with primer pairs V3-338F (5′-ACTCCT distribution of the variance of T-RFLP profiles within and
ACGGGAGGCAGCAG-3′)and V3-533R(5′-TTACCGCG among beaches and on the Y-axis, AMOVA (Analysis of
GCTGCTGGCAC-3′) (Huse et al. 2008). PCR conditions Molecular Variance, Excoffier et al. 1992) was applied using
were as described in Sogin and coworkers (Sogin et al. Arlequin 3.11 software (Excoffier et al. 2007). AMOVA was
2006). Ten independent PCR reactions per sample were done, used as a statistical methodology alternative to the classical
then pooled together to produce three representative PCR analysis of variance (ANOVA). AMOVA is more flexible for
amplicon libraries for each environmental DNA sampling biological data than classical ANOVA because it does not
point (shore-line, mid-line, upper-line). Products were re- require a prior assumption of normality of the dataset and
solved by agarose gel electrophoresis and bands were purified statistical significance is computed through a permutation test
with a MinElute Gel Extraction Kit (Qiagen, Inc.). Quality (Excoffier et al. 1992; Mengoni and Bazzicalupo 2002), and it
and quantity of products was assessed on a Biophotometer has been widely applied to analyze community profiles in
(Eppendorf). molecular microbial ecology (for examples see Dalmastri