
Page 9 - Bacci_Pagoto_etali_2015
P. 9
Author's personal copy
Ann Microbiol (2015) 65:1–13 7
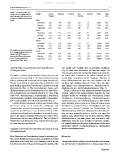
Table 3 Diversity indices of
samples from Faraglioni beach Sample Inverse Shannon Evenness Beta Richness Chao1 Chao1
after collapsing 16S rRNA gene Simpson diversity error
sequences to different taxonomic
levels Class
Shore-line 3.36 1.47 0.50 1.33 19 21.00 5.29
Mid-line 3.02 1.40 0.47 1.26 20 21.00 3.40
Upper-line 2.41 1.27 0.41 1.09 23 23.75 2.29
Order
Shore-line 6.19 2.11 0.55 1.26 47 54.20 9.02
Mid-line 7.61 2.36 0.60 1.18 50 57.00 10.27
Upper-line 6.37 2.17 0.54 1.04 57 62.25 8.28
Family
Shore-line 4.39 2.10 0.46 1.41 97 140.88 29.00
Mid-line 5.34 2.34 0.50 1.31 104 147.88 29.00
Upper-line 6.73 2.32 0.49 1.16 117 153.91 21.51
The analysis is based on samples
Genus
from Faraglioni beach, after col-
Shore-line 17.06 3.54 0.70 1.76 153 235.50 33.62
lapsing 16S rRNA gene se-
quences to different taxonomic Mid-line 9.10 3.21 0.62 1.51 178 262.91 31.25
levels. Unseen species are Upper-line 6.51 2.53 0.47 1.24 218 598.00 153.90
expressed as Chao1 index
Bacterial phyla composition and sea-to-land differences class Bacilli,order Bacillales (Fig. 2)and family Bacillaceae
of Faraglioni beach (Fig. 4), which were abundant in the shore-line sample. For
Proteobacteria, shore-line and mid-line samples were more sim-
The pattern of relative phyla abundance along the Y-axis are ilar toeach other, contrarily to the pattern observed for the
reported as a heat map in Fig. 3. The clustering of the heat map overall phyla composition and for Firmicutes. Members of
patterns indicated that at the phylum level upper-line and mid- family Rhodobacteraceae were the most abundant and did
line are more similar to each other, than to shore-line. The not show high variability along the Y-axis. Other less abun-
most abundant phyla were Proteobacteria, Actinobacteria and dant families were Alteromonadaceae, Rhodobacteraceae,
Bacteroidetes (Fig. 2). The most abundant classes were Erythrobacteraceae,and Ectothiorhodospiraceae (Fig. 4).
Alphaproteobacteria and Gammaproteobacteria,then follow- Finally, to allow one to infer additionally potential functional
ed by Flavobacteria and Actinobacteria (Fig. 2). Then, at the activities related to the bacterial families detected, the most
order level, Flavobacteriales, Actynomicetales, Rhizobiales, abundant families for Firmicutes and Proteobacteria, namely
Rhodobacterales, Bacillales, Alteromonadales, Chromatiales, Bacillaceae, Alteromonadaceae, Rhodobacteraceae,
and Oceanospirillales were the most represented (Fig. 2). Erythrobacteraceae,and Ectothiorhodospiraceae were investi-
Different trends of abundance of phyla were detected along gated collapsing reads at genus level. Observed relative genera
the Y-axis (Fig. 3). In particular, Firmicutes and abundances are reported in Fig. 5.For Bacillaceae,two main
Proteobacteria presented increasing and decreasing trends, genera were detected, Bacillus and Halobacillus.For
respectively (Wilcoxon test p-value < 0.05), while Alteromonadaceae, which were mainly found in shore-line sam-
Actinobacteria showed lower abundance in the mid-line com- ples and were practically absent in mid-line and upper-line
pared to the other two samples (Wilcoxon test p-value<0.05). samples, genus Marinobacter was the most abundant. Within
Bacteroidetes did not show differences. The two phyla of Rhodobacteraceae, ten main genera were represented, with
Fusobacteria and Nitrospirae were excluded from the analy- Sulfitobacter being the most abundant in upper-line samples.
sis, since they have too few hits. For Erythrobacteraceae, the genus Erythrobacter was the most
represented, while for Ectothiorhodospiraceae, Thiohalospira
Variability of Proteobacteria and Firmicutes along the Y-axis was the most abundant genus.
of Faraglioni beach
Since Firmicutes and Proteobacteria showed a contrasting pro- Discussion
file, a more detailed taxonomic analysis was performed in these
phyla down to the family level. For Firmicutes, most of the hits The supralittoral belt is a highly dynamic transition zone between
were due to members of the spore-forming aerobic bacteria of the sea and land and is characterized by a sharp passage from a