
Page 8 - Bacci_Pagoto_etali_2015
P. 8
Author's personal copy
6 Ann Microbiol (2015) 65:1–13
particular, one main cluster including samples from Praja and products, suggesting that most of first amplification amplicons
Lido Burrone only, while another one including all samples were due to amoA-related sequences.
from Faraglioni and some samples from Lido Burrone, were
identified. In agreement with CCA, in this latter cluster, all
upper-line samples from Faraglioni and Lido Burrone grouped Diversity of 16S rRNA gene amplicon libraries
together at the Jaccard similarity >0.50. Finally, it is interest- from Faraglioni beach
ing to notice, that in both CCA and UPGMA, several triplicate
samples from the same point along the Y-axis clustered to- Since T-RFLP analysis showed a pattern of community diver-
gether at theJaccard similarity > 0.60 (i.e., Faraglioni mid-line, sity along the Y-axis, we focused on one locality only for an
Lido Burrone mid-line, Praja upper-line, Praja shore-line, and in-deep taxonomic investigation by massive sequencing of
Faraglioni sore-line). To quantitatively evaluate the contribu- 16S rRNA gene amplicons. We selected the locality of
tion of Y-axis position and of locality (single beach) an Faraglioni because of the lower anthropic impact and higher
AMOVA was carried out on T-RFLP profiles. A two-levels organic carbon present, with respect to the other two localities.
hierarchical partition (among sampling points and within A total of 380,080, 391,008, and 382,584 reads for shore-line,
sampling points partitions) showed that most of the variance mid-line and upper-line samples, respectively, were analyzed.
is due to differences between sampling points (73.37%, Results (Table 3,Fig.S3) indicated differences in the coverage
P<0.0001). On a three-levels hierarchical analysis of diversity of samples along the Y-axis. In particular, upper-
(Table 2), localities and Y-axis similarly contributed to line was the most diverse, while mid-line and shore-line
bacterial community differentiation (8.9 and 8.5% of variance, samples were less diverse. In order to have an idea of the
respectively). number of unseen taxa present in the samples, the nonpara-
To evaluate the functionality of bacterial communities in metric estimator Chao I was also calculated (Table 3),
terms of performance, some of the steps of the biogeochemical allowing to show an underestimation for all the three samples
cycle of nitrogen and of carbon were checked. In particular, along the Y-axis, which accounted for ∼44 Families.
three gene fragments, for which “universal” primers have Considering higher taxonomic levels (order and class), the
been developed, were chosen: i) nifH (encoding the nitroge- difference between observed and predicted values of
nase reductase subunit), ii) nosZ (encoding the nitrous oxide richness were clearly reduced. In general, Richness and
reductase gene), and iii) pmoA/amoA (the conserved internal inverse Simpson indices were in agreement with the
fragment of particulate methane monooxygenase and ammo- above mentioned coverage data, showing a profile of
nia monooxygenase genes). Amplicons were detected only for increasing diversity along the Y-axis from shore-line to
pmoA/amoAwith primer pair A189F/A682R in Faraglioni and upper-line, while Evenness and Shannon-Weaver indices
Praja shore line samples. Semi-nested reamplification with have a similar profile and did not allow for resolving
A189F/mb661 primer pair did not produced amplification the variability on the Y-axis.
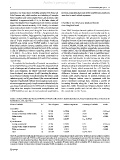
Table 2 Analysis of Molecular Variance (AMOVA) of T-RFLP profiles for three localities (Lido Burrone, Praja, Faraglioni) and three environments for
locality (shore-, mid-, upper-line)
Source of variation d.f. Sum of squares Variance components Percentage of variation P-value
a) Localities
Among localities 2 25.704 0.37860 8.87 <0.2 (n.s.)
Among environments within locality 6 56.667 2.77778 65.09 <0.0001
Within locality 18 20.000 1.11111 26.04 <0.0001
Total 26 102.370 4.26749 F ST =0.73963
b) Environments
Among environments 2 25.926 0.37037 8.57 <0.2 (n.s.)
Among locality within environment 6 57.778 2.83951 65.71 <0.0001
Within environment 18 20.000 1.11111 25.71 <0.0001
Total 26 103.704 4.32099 F ST =0.71875
AMOVAwas performed attributing the following two types of groupings: Computation a) is made with T-RFLP profiles grouped according to localities.
Computation b) is made with T-RFLP profiles grouped according to the environment. For each grouping the percent of the total variance observed was
attributed to the two hierarchical partitions. Data show the degrees of freedom (d.f.), the sum of squared deviation, the variance component estimate, the
percentage of total variance contributed by each component, the F ST statistics (Fixation index), and the probability (P) of obtaining a more extreme
component estimate by chance alone estimated computing 10,000 permutations; n.s., not significant