
Page 3 - Castriota_alii_2014
P. 3
CASTRIOTA ET AL. Biologica/ date on Fistularia conunersonii
to the usually employed caudal ones because of their larger growth (b :t 3) the Student's t-test (Snedecor and Cochran,
centrum size and easier readability. Up to 10 thoracic verte- 1967) was employed.
brae were extracted from each specimen, cleaned from fieshy
parts after immersion in boiling water and deprived of neural
and hemal spines. The intact centra were cleaned of gelati- RESULTS
nous tissue by scratching gently, they were stained with ali-
zarin red in a solution of NaOH and glycerine for 4-8 hours, Diet
washed, dried and stored with a code number (Morales-Nin Out of77 individuals examined, 49 had empty stomachs
et al., 1999) . Stained vertebrae were examined with aster- (%Cv = 63 .6) . Specimens ranged from 69.2 to 107.5 cm TL
eomicroscope under refiected light. They displayed distinct (80.3 ± 7.5 cm). Stomach contents analysis led to the iden-
altemating light and dark rings. Even if it was not possible tification of 15 prey items, all belonging to teleosts, fora
to carry out any age validation, dark and light ring formation total weight of 60 .76 g. The values of dietary indexes of the
seems to follow the classic annual growth of fish from tem- identified prey items are listed in table I. Sardine!la aurita
perate waters. Then, it was assumed that each set of one dark Valenciennes, 1847, Serranuscabrilla (Linnaeus, 1758) and
and one light ring may represent an annual growth zone. The Boops boops (Linnaeus, 1758) were the most frequent spe-
vertebra! ring-count was given by the number of complete cies (%F = 10.3) . The clupeid S. aurita resulted the most
growth rings observed. At least four vertebrae for each spec- important prey in terms of mass (%W = 24.3), abundance
imen were read and growth increments were independently (%N = 10.4), and o/o!RI (32.7). Boops boops represented the
counted by two operators in order to limit interpretation mis- second important species (o/o!RI = 16.5). Values of o/o!RI
takes . As a rule, when readings were discordant, a second calculated per prey family highlighted the importance of
observation was carried out and if this last reading still pro-
vided different results, the vertebra was rejected. Centracanthidae
4%
Growth
Growth parameters (TL:c, k, to) were estimateci by fitting Clupei dae
28%
age and related length data into the theoretical growth model
ofvon Bertalanffy (1938): Pomacentridae Gobiidae
TLt = TL:c [1- e-k<t - to>] 9% 1%
where TL1 is the total length at age t (years), TLx is the pre-
dicted asymptotic length, k is the instantaneous growth coef-
ficient, describing how rapidly this length is achieved, to is
the theoretical age at zero length (years). Finally, the growth
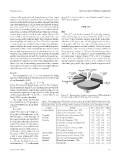
performance index (et> ' = 2 log TL:c + log k) (Munro and Figure 2. - Percent index of relative importance (%1Rl) calculated
Pauly, 1983) was also calculated. per prey family in the diet of bluespotted cornetfish.
The weight-length relationship Table l. Diet composition of Fistularia commersonii in the central Mediterranean Sea and die-
was calculated on 60 specimens
using the potential equation (Rick- tary indexes calculated for each prey item: percent frequency of occurrence (%F), percent of
er, 1975):
-·total number (%N), percent of wei2ht (%W), and percent index of relative importance (%1Rl) .
W =aTLb Family Species %F %N %W %1Rl
where W is the total weight (g),
TL is the total length (cm) with- Centracanthidae Spicarafiexuosa Rafinesque, 1810 3.4 2.1 8.1 3.2
out filament, a is the intercept of
the regression line and represents Spicara smaris (Linnaeus, 1758) 3.4 2.1 3.6 1.8
a coefficient related to the body
shape of the species, bis the regres- Clupeidae Sardine/la aurita Valenciennes, 1847 10.3 10.4 24.1 32.7
sion coefficient and indicates the
isometric growth when equal to Gobiidae Unidentified Gobiidae 3.4 2.1 0.4 0.8
3 (Wootton, 1990; Anderson and
Neumann, 1996). The parameters Labridae Coris julis (Linnaeus, 1758) 6.9 4.2 2.4 4.1
a and b were estimateci by lin-
ear regression analysis on /n-trans- Symplwdus ocellatus (Forsskal, 1775) 6.9 4.2 6.5 6.7
formed data. To check the theoreti-
cal isometric (b = 3) or allometric Symplwdus sp. 3.4 2.1 0.8 0.9
Thalassoma pavo (Linnaeus, 1758) 3.4 4.2 12.5 5.3
Unidentified Labridae 3.4 2.1 0.0 0.7
Pomacentridae Chromis chromis (Linnaeus, 1758) 6.9 4.2 13.1 10.9
Scaridae Sparisoma cretense (Linnaeus, 1758) 3.4 2.1 13.2 4.8
Serranidae Serranus cabri/la (Linnaeus, 1758) 10.3 6.3 4.7 10.4
Sparidae Boops boops (Linnaeus, 1758) 10.3 8.3 9.0 16.5
Pagellus sp. 3.4 2.1 1.4 1.1
Cybium 2014, 38(1) 17