
Page 12 - HIMES_2007_
P. 12
612 A. H. Himes
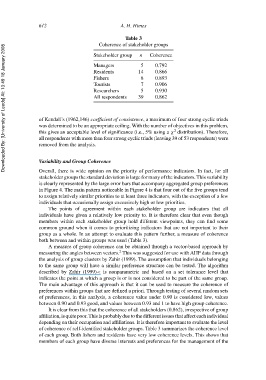
Table 3
Coherence of stakeholder groups
Downloaded By: [University of Leeds] At: 13:49 18 January 2008
Stakeholder group n Coherence
Managers 5 0.792
Residents 14 0.866
Fishers 8 0.893
Tourists 7 0.906
Researchers 5 0.930
All respondents 39 0.862
of Kendall’s (1962,146) coefficient of consistence, a maximum of four strong cyclic triads
was determined to be an appropriate ceiling. With the number of objectives in this problem,
2
this gives an acceptable level of significance (i.e., 5% using a χ distribution). Therefore,
all respondents with more than four strong cyclic triads (leaving 39 of 53 respondents) were
removed from the analysis.
Variability and Group Coherence
Overall, there is wide opinion on the priority of performance indicators. In fact, for all
stakeholder groups the standard deviation is large for many of the indicators. This variability
is clearly represented by the large error bars that accompany aggregated group preferences
in Figure 4. The main pattern noticeable in Figure 4 is that four out of the five groups tend
to assign relatively similar priorities to at least three indicators, with the exception of a few
individuals that occasionally assign excessively high or low priorities.
The points of agreement within each stakeholder group are indicators that all
individuals have given a relatively low priority to. It is therefore clear that even though
members within each stakeholder group hold different viewpoints, they can find some
common ground when it comes to prioritizing indicators that are not important to their
group as a whole. In an attempt to evaluate this pattern further, a measure of coherence
both between and within groups was used (Table 3).
A measure of group coherence can be obtained through a vector-based approach by
2
measuring the angles between vectors. This was suggested for use with AHP data through
the analysis of group clusters by Zahir (1999). The assumption that individuals belonging
to the same group will have a similar preference structure can be tested. The algorithm
described by Zahir (1999)< is nonparametric and based on a set tolerance level that
indicates the point at which a group is or is not considered to be part of the same group.
The main advantage of this approach is that it can be used to measure the coherence of
preferences within groups that are defined a priori. Through testing of several random sets
of preferences, in this analysis, a coherence value under 0.90 is considered low, values
between 0.90 and 0.93 good, and values between 0.93 and 1 to have high group coherence.
It is clear from this that the coherence of all stakeholders (0.862), irrespective of group
affiliation, is quite poor. This is probably due to the different issues that affect each individual
depending on their occupation and affiliations. It is therefore important to evaluate the level
of coherence of self-identified stakeholder groups. Table 3 summarizes the coherence level
of each group. Both fishers and residents have very low coherence levels. This shows that
members of each group have diverse interests and preferences for the management of the