
Page 14 - Habitat_Selection_2014
P. 14
Habitat Selection Response of Anchovy and Sardine
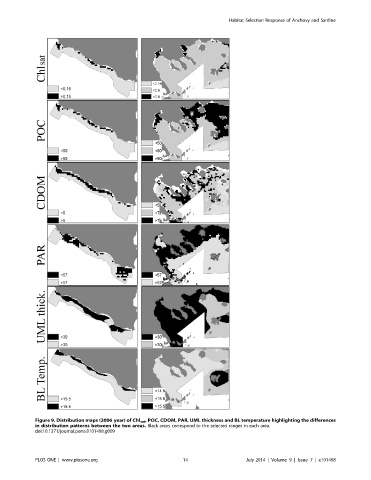
Figure 9. Distribution maps (2006 year) of Chl sat , POC, CDOM, PAR, UML thickness and BL temperature highlighting the differences
in distribution patterns between the two areas. Black areas correspond to the selected ranges in each area.
doi:10.1371/journal.pone.0101498.g009
PLOS ONE | www.plosone.org 14 July 2014 | Volume 9 | Issue 7 | e101498