
Page 9 - Habitat_Selection_2014
P. 9
Habitat Selection Response of Anchovy and Sardine
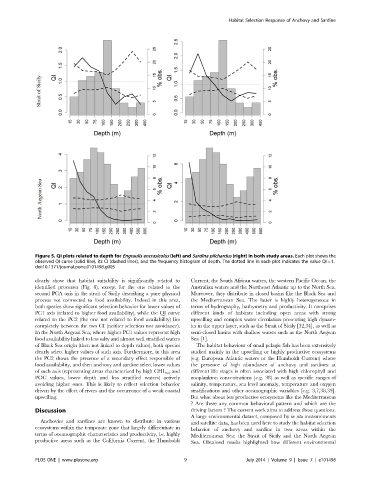
Figure 5. QI plots related to depth for Engraulis encrasicolus (left) and Sardina pilchardus (right) in both study areas. Each plot shows the
observed QI curve (solid line), its CI (dashed lines), and the frequency histogram of depth. The dotted line in each plot indicates the value QI = 1.
doi:10.1371/journal.pone.0101498.g005
clearly show that habitat suitability is significantly related to Current, the South African waters, the western Pacific Ocean, the
identified processes (Fig. 8), except for the one related to the Australian waters and the Northeast Atlantic up to the North Sea.
second PCA axis in the strait of Sicily describing a pure physical Moreover, they distribute in closed basins like the Black Sea and
process not connected to food availability. Indeed in this area, the Mediterranean Sea. The latter is highly heterogeneous in
both species show significant selection behavior for lower values of terms of hydrography, bathymetry and productivity. It comprises
PC1 axis (related to higher food availability), while the QI curve different kinds of habitats including open areas with strong
related to the PC2 (the one not related to food availability) lies upwelling and complex water circulation presenting high dynam-
completely between the two CI (neither selection nor avoidance). ics in the upper layer, such as the Strait of Sicily [32,34], as well as
In the North Aegean Sea, where higher PC1 values represent high semi-closed basins with shallow waters such as the North Aegean
food availability linked to less salty and almost well stratified waters Sea [1].
of Black Sea origin (then not linked to depth values), both species The habitat behaviour of small pelagic fish has been extensively
clearly select higher values of such axis. Furthermore, in this area studied mainly in the upwelling or highly productive ecosystems
the PC2 shows the presence of a secondary effect responsible of (e.g. European Atlantic waters or the Humboldt Current) where
food availability, and then anchovy and sardine select lower values the presence of high abundance of anchovy and sardines at
of such axis (representing areas characterized by high CHL sat and different life stages is often associated with high chlorophyll and
POC values, lower depth and less stratified waters) actively zooplankton concentrations [e.g. 38] as well as specific ranges of
avoiding higher ones. This is likely to reflect selection behavior salinity, temperature, sea level anomaly, temperature and oxygen
driven by the effect of rivers and the occurrence of a weak coastal stratifications and other oceanographic variables [e.g. 3,7,38,39].
upwelling. But what about less productive ecosystems like the Mediterranean
? Are there any common behavioral pattern and which are the
Discussion driving factors ? The current work aims to address these questions.
A large environmental dataset, composed by in situ measurements
Anchovies and sardines are known to distribute in various and satellite data, has been used here to study the habitat selection
ecosystems within the temperate zone that largely differentiate in behavior of anchovy and sardine in two areas within the
terms of oceanographic characteristics and productivity, i.e. highly Mediterranean Sea: the Strait of Sicily and the North Aegean
productive areas such as the California Current, the Humboldt Sea. Obtained results highlighted how different environmental
PLOS ONE | www.plosone.org 9 July 2014 | Volume 9 | Issue 7 | e101498