
Page 6 - Habitat_Selection_2014
P. 6
Habitat Selection Response of Anchovy and Sardine
application of QI analysis was obtained, which permitted to relate
the identified physical processes and habitat selection. Principal
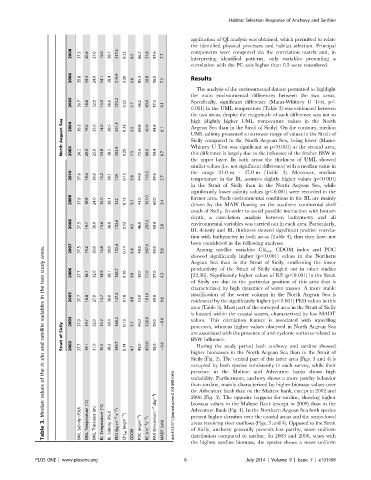
2008 37.2 20.4 37.0 15.0 38.7 317.6 0.22 6.5 66.2 37.8 57.6 7.7 components were computed via the correlation matrix and, in
interpreting identified patterns, only variables presenting a
correlation with the PC axis higher than 0.5 were considered.
2006 35.8 19.3 24.0 14.1 38.4 319.9 0.30 6.6 85.3 20.8 56.0 7.1 Results
The analysis of the environmental dataset permitted to highlight
the main environmental differences between the two areas.
2005 36.7 18.6 32.0 14.3 38.6 274.2 0.22 5.7 66.2 43.0 57.3 9.1 Specifically, significant difference (Mann-Whitney U Test, p,
0.001) in the UML temperature (Table 3) was evidenced between
the two areas, despite the magnitude of such difference was not so
Sea 2004 36.3 18.5 35.0 14.0 38.5 291.5 0.25 69.8 40.9 54.8 high (slightly higher UML temperature values in the North
Aegean Sea than in the Strait of Sicily). On the contrary, median
Aegean 5.5 6.1 UML salinity presented a narrower range of values in the Strait of
Sicily compared to the North Aegean Sea, being lower (Mann-
North 2003 36.2 20.0 25.0 13.8 38.5 353.9 0.25 7.5 72.6 60.6 59.4 6.7 Whitney U Test was significant at p,0.001) at the second area;
this difference is largely due to the influence of the fresher BSW in
the upper layer. In both areas the thickness of UML showed
similar values (i.e. not significant difference) with a median value in
2010 37.6 18.4 36.0 15.2 38.1 139 0.12 5.8 44.0 135.5 59.0 2.7 the range 24.0 m - 37.0 m (Table 3). Moreover, median
temperature in the BL assumes slightly higher values (p,0.001)
in the Strait of Sicily than in the North Aegean Sea, while
significantly lower salinity values (p,0.001) were recorded in the
2009 37.6 18.8 24.0 15.0 38.1 122 0.12 5.7 43.0 157.0 60.0 3.4 former area. Such environmental conditions in the BL are mainly
driven by the MAW flowing on the southern continental shelf
south of Sicily. In order to avoid possible interaction with bottom
depth, a correlation analysis between bathymetry and all
2008 37.5 19.7 30.0 15.6 38.0 152.6 0.13 4.5 46.0 297.5 59.0 3.8 environmental variables was carried out in each area. Particularly,
BL density and BL thickness showed significant positive correla-
tion with bathymetry in both areas (Table 4), thus they have not
been considered in the following analyses.
areas. 2007 37.5 19.2 30.0 15.8 38.0 152.4 0.14 4.4 48.0 597.0 59.0 5.8 showed significantly higher (p,0.001) values in the Northern
Among satellite variables Chl sat , CDOM index and POC
study 2006 138.7 Aegean Sea than in the Strait of Sicily, confirming the lower
productivity of the Strait of Sicily singled out in other studies
two 37.7 18.7 32.0 14.9 38.1 0.10 3.8 39.0 71.0 57.0 4.3 [32,36]. Significantly higher values of KE (p,0.001) in the Strait
of Sicily are due to the particular position of this area that is
the characterized by high dynamics of water masses. A more stable
in 2005 37.7 18.8 27.0 14.7 38.0 147.2 0.16 4.8 53.0 101.0 59.0 0.6 stratification of the water column in the North Aegean Sea is
evidenced by the significantly higher (p,0.001) PED values in this
variables area (Table 3). Most part of the surveyed area in the Strait of Sicily
is located within the coastal waters, characterized by low MADT
values. This circulation feature is associated with upwelling
satellite Sicily of 2003 37.9 19.7 32.0 15.2 38.4 160.2 0.13 5.7 46.0 126.0 59.0 20.6 processes, whereas higher values observed in North Aegean Sea
are associated with the presence of anti-cyclonic vortexes related to
and Strait 2002 37.7 19.1 31.0 15.5 38.2 159.7 0.14 4.7 49.0 453.0 58.0 20.6 BSW influence.
During the study period both anchovy and sardine showed
situ higher biomasses in the North Aegean Sea than in the Strait of
Sicily (Fig. 2). The central part of this latter area (Figs. 3 and 4) is
in occupied by both species consistently in each survey, while their
the presence in the Maltese and Adventure banks shows high
of variability. Furthermore, anchovy shows a more patchy behavior
than sardine, mainly characterized by higher biomass values over
values day 21 ) the Adventure bank than on the Maltese bank, except in 2002 and
2008 (Fig. 3). The opposite happens for sardine, showing higher
Median (PSU) (uC) (m) (uC) s 22 ) doi:10.1371/journal.pone.0101498.t003 biomass values in the Maltese Bank (except in 2009) than in the
Adventure Bank (Fig. 4). In the Northern Aegean Sea both species
3. Salinity Temperature Thickness Temperature (PSU) m 22 (mgm 23 ) (mgm 23 ) (cm 22 s 22 ) (Einsteinsm 22 (cm) present higher densities over the coastal areas and the semi-closed
areas receiving river outflows (Figs. 3 and 4). Opposed to the Strait
Table UML UML UML Salinity (kg PED Chl sat CDOM POC PAR MADT of Sicily, anchovy generally presents less patchy, more uniform
distribution compared to sardine. In 2003 and 2006, years with
KE
BL
BL
the highest sardine biomass, the species shows a more uniform
PLOS ONE | www.plosone.org 6 July 2014 | Volume 9 | Issue 7 | e101498