
Page 4 - Habitat_Selection_2014
P. 4
Habitat Selection Response of Anchovy and Sardine
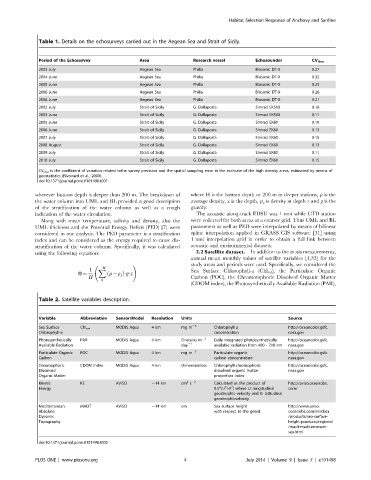
Table 1. Details on the echosurveys carried out in the Aegean Sea and Strait of Sicily.
Period of the Echosurvey Area Research vessel Echosounder CV Geo
2003 July Aegean Sea Philia Biosonic DT-X 0.27
2004 June Aegean Sea Philia Biosonic DT-X 0.32
2005 June Aegean Sea Philia Biosonic DT-X 0.23
2006 June Aegean Sea Philia Biosonic DT-X 0.26
2008 June Aegean Sea Philia Biosonic DT-X 0.21
2002 July Strait of Sicily G. Dallaporta Simrad EK500 0.16
2003 June Strait of Sicily G. Dallaporta Simrad EK500 0.11
2005 June Strait of Sicily G. Dallaporta Simrad EK60 0.10
2006 June Strait of Sicily G. Dallaporta Simrad EK60 0.13
2007 July Strait of Sicily G. Dallaporta Simrad EK60 0.15
2008 August Strait of Sicily G. Dallaporta Simrad EK60 0.13
2009 July Strait of Sicily G. Dallaporta Simrad EK60 0.11
2010 July Strait of Sicily G. Dallaporta Simrad EK60 0.15
CV Geo is the coefficient of variation related tothe survey precision and the spatial sampling error in the estimate of the high density areas, estimated by means of
geostatistics (Rivoirard et al., 2000).
doi:10.1371/journal.pone.0101498.t001
wherever bottom depth is deeper than 200 m. The breakdown of where H is the bottom depth or 200 m in deeper stations, r is the
the water column into UML and BL provided a good description average density, z is the depth, r z is density at depth z and g is the
of the stratification of the water column as well as a rough gravity.
indication of the water circulation. The acoustic along-track EDSU was 1 nmi while CTD station
Along with mean temperature, salinity and density, also the were collected for both areas at a coarser grid. Thus UML and BL
UML thickness and the Potential Energy Deficit (PED) [7] were parameters as well as PED were interpolated by means of bilinear
considered in our analysis. The PED parameter is a stratification spline interpolation applied in GRASS GIS software [31] using
index and can be considered as the energy required to cause dis- 1 nmi interpolation grid in order to obtain a full link between
stratification of the water column. Specifically, it was calculated acoustic and environmental datasets.
using the following equation: 2.2 Satellite dataset. In addition to the in situ measurements,
annual mean monthly values of satellite variables [1,32] for the
! study areas and periods were used. Specifically, we considered the
{H
1 X Sea Surface Chlorophyll-a (Chl sat ), the Particulate Organic
: :
W~ ð r{r Þ g z
z
H Carbon (POC), the Chromotophoric Dissolved Organic Matter
0
(CDOM index), the Photosynthetically Available Radiation (PAR),
Table 2. Satellite variables description.
Variable Abbreviation Sensor/Model Resolution Units Source
23
Sea Surface Chl sat MODIS Aqua 4 km mg m Chlorophyll a http://oceancolor.gsfc.
Chlorophyll-a concentration nasa.gov
Photosynthetically PAR MODIS Aqua 4 km Einsteins m 22 Daily integrated photosynthetically http://oceancolor.gsfc.
Available Radiation day 21 available radiation from 400 - 700 nm nasa.gov
Particulate Organic POC MODIS Aqua 4 km mg m 23 Particulate organic http://oceancolor.gsfc.
Carbon carbon concentration nasa.gov
Chromophoric CDOM Index MODIS Aqua 4 km Dimensionless Chlorophyll-chromophoric http://oceancolor.gsfc.
Dissolved dissolved organic matter nasa.gov
Organic Matter proportion index
2
Kinetic KE AVISO ,14 km cm s 22 Calculated as the product of http://aviso.oceanobs.
2
2
Energy 0.5*(U +V ) where U: longitudinal com/
geostrophic velocity and V: latitudinal
geostrophicvelocity
Mediterranean MADT AVISO ,14 km cm Sea surface height http://www.aviso.
Absolute with respect to the geoid oceanobs.com/en/data
Dynamic /products/sea-surface-
Topography height-products/regional
/madt-mediterranean-
sea.html
doi:10.1371/journal.pone.0101498.t002
PLOS ONE | www.plosone.org 4 July 2014 | Volume 9 | Issue 7 | e101498