
Page 3 - Habitat_Selection_2014
P. 3
Habitat Selection Response of Anchovy and Sardine
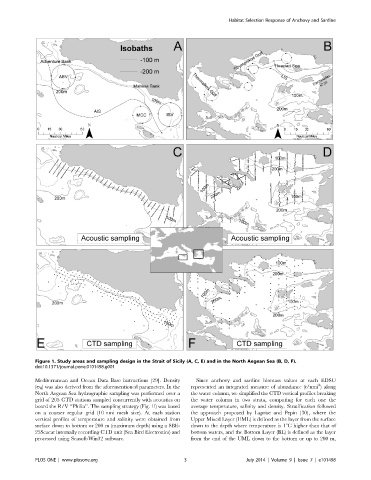
Figure 1. Study areas and sampling design in the Strait of Sicily (A, C, E) and in the North Aegean Sea (B, D, F).
doi:10.1371/journal.pone.0101498.g001
Mediterranean and Ocean Data Base instructions [29]. Density Since anchovy and sardine biomass values at each EDSU
2
(s h ) was also derived from the aforementioned parameters. In the represented an integrated measure of abundance (t/nmi ) along
North Aegean Sea hydrographic sampling was performed over a the water column, we simplified the CTD vertical profiles breaking
grid of 205 CTD stations sampled concurrently with acoustics on the water column in two strata, computing for each one the
board the R/V ‘‘Philia’’. The sampling strategy (Fig. 1f) was based average temperature, salinity and density. Stratification followed
on a coarser regular grid (10 nmi mesh size). At each station the approach proposed by Laprise and Pepin [30], where the
vertical profiles of temperature and salinity were obtained from Upper Mixed Layer (UML) is defined as the layer from the surface
surface down to bottom or 200 m (maximum depth) using a SBE- down to the depth where temperature is 1uC higher than that of
25Seacat internally recording CTD unit (Sea Bird Electronics) and bottom waters, and the Bottom Layer (BL) is defined as the layer
processed using Seasoft-Win32 software. from the end of the UML down to the bottom or up to 200 m,
PLOS ONE | www.plosone.org 3 July 2014 | Volume 9 | Issue 7 | e101498