
Page 11 - Habitat_Selection_2014
P. 11
Habitat Selection Response of Anchovy and Sardine
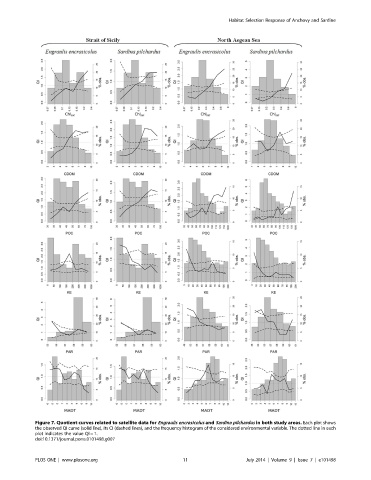
Figure 7. Quotient curves related to satellite data for Engraulis encrasicolus and Sardina pilchardus in both study areas. Each plot shows
the observed QI curve (solid line), its CI (dashed lines), and the frequency histogram of the considered environmental variable. The dotted line in each
plot indicates the value QI = 1.
doi:10.1371/journal.pone.0101498.g007
PLOS ONE | www.plosone.org 11 July 2014 | Volume 9 | Issue 7 | e101498