
Page 5 - Invasive_rats_2009
P. 5
Invasive rats and seabirds after 2,000 years 1635
as potential sources of permanent rat populations, since remove right skew distribution and increase normal-
86% of islands C5 ha housed ship rats in our dataset. ity of their distribution (Sokal and Rohlf 1995;
We reviewed studies reporting ship rat impact on Russell and Clout 2004). Cory’s and Balearic shear-
Mediterranean Procellariiformes throughout the entire water breeding success were arcsin-square-root
basin by collecting data from published works, transformed (Sokal and Rohlf 1995). Before con-
unpublished reports, and personal communications. structing GLMs, we used Spearman rank correlations
Finally, we collected data on the breeding success of to identify colinearity between explanatory variables.
Cory’s and Balearic shearwaters in three situations Even though island area and island elevation were
2
(Table 1): (1) rat-inhabited islands, (2) islands where correlated (r = 0.73), we kept the two terms in the
rats have been controlled within shearwater colonies, models since these two factors are known to be
and (3) rat-free islands (either absent or eradicated). potential predictors of seabird presence and abun-
Unfortunately, for the two other Procellariiform species dance (Schramm 1986; Brandt et al. 1995; Muller-
(storm petrel and Yelkouan shearwater), reliable data Dombois 1999; Lomolino 2000; Sullivan and Wilson
on the breeding success were too sparse to be used. 2001; Catry et al. 2003). Furthermore, explanatory
value would be lost by arbitrarily dropping one of the
Statistical analysis variables (Russell and Clout 2004). Models were
constructed in order to identify and interpret explan-
In order to highlight factors likely to explain ship rat atory variables, not to maximize predictive power
presence on Western Mediterranean islands, we con- (Russell and Clout 2004).
structed a generalized linear model (GLM, binomial
distribution, LOGIT link function) for a set of 257
islands and islets (see Table 1; Appendix 1). For Results
seabirds, GLMs (binomial distribution, LOGIT link
function) were first performed to explore how seabird Factors affecting the distribution of ship rats
presence on islands may be influenced by the a priori on Mediterranean islands
selected explanatory variables for each seabird species
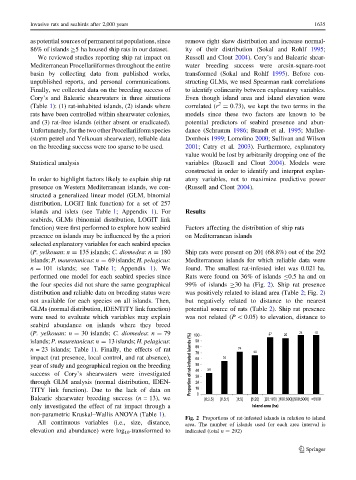
(P. yelkouan: n = 135 islands; C. diomedea: n = 180 Ship rats were present on 201 (68.8%) out of the 292
islands; P. mauretanicus: n = 69 islands; H. pelagicus: Mediterranean islands for which reliable data were
n = 101 islands; see Table 1; Appendix 1). We found. The smallest rat-infested islet was 0.021 ha.
performed one model for each seabird species since Rats were found on 36% of islands B0.5 ha and on
the four species did not share the same geographical 99% of islands C30 ha (Fig. 2). Ship rat presence
distribution and reliable data on breeding status were was positively related to island area (Table 2; Fig. 2)
not available for each species on all islands. Then, but negatively related to distance to the nearest
GLMs (normal distribution, IDENTITY link function) potential source of rats (Table 2). Ship rat presence
were used to evaluate which variables may explain was not related (P \ 0.05) to elevation, distance to
seabird abundance on islands where they breed
(P. yelkouan: n = 30 islands; C. diomedea: n = 79
islands; P. mauretanicus: n = 13 islands; H. pelagicus:
n = 23 islands; Table 1). Finally, the effects of rat
impact (rat presence, local control, and rat absence),
year of study and geographical region on the breeding
success of Cory’s shearwaters were investigated
through GLM analysis (normal distribution, IDEN-
TITY link function). Due to the lack of data on
Balearic shearwater breeding success (n = 13), we
only investigated the effect of rat impact through a
non-parametric Kruskal–Wallis ANOVA (Table 1).
Fig. 2 Proportions of rat-infested islands in relation to island
All continuous variables (i.e., size, distance, area. The number of islands used for each area interval is
elevation and abundance) were log 10 -transformed to indicated (total n = 292)
123