
Page 6 - Invasive_rats_2009
P. 6
1636 L. Ruffino et al.
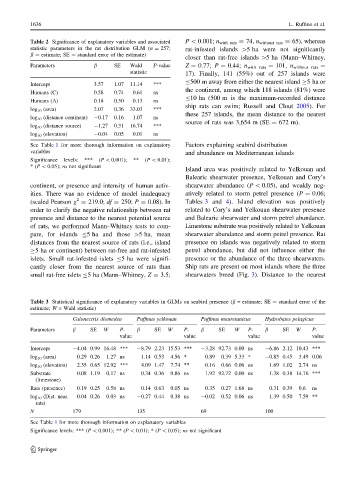
Table 2 Significance of explanatory variables and associated P \ 0.001; n with rats = 74, n without rats = 65), whereas
statistic parameters in the rat distribution GLM (n = 257; rat-infested islands [5 ha were not significantly
b = estimate; SE = standard error of the estimate)
closer than rat-free islands [5 ha (Mann–Whitney,
Parameters b SE Wald P-value Z = 0.77; P = 0.44; n with rats = 101, n without rats =
statistic 17). Finally, 141 (55%) out of 257 islands were
B500 m away from either the nearest island C5ha or
Intercept 3.57 1.07 11.14 ***
the continent, among which 118 islands (81%) were
Humans (C) 0.58 0.74 0.61 ns
B10 ha (500 m is the maximum-recorded distance
Humans (A) 0.18 0.50 0.13 ns
ship rats can swim; Russell and Clout 2005). For
log 10 (area) 2.07 0.36 33.03 ***
these 257 islands, the mean distance to the nearest
log 10 (distance continent) -0.17 0.16 1.07 ns
source of rats was 3,654 m (SE = 672 m).
log 10 (distance source) -1.27 0.31 16.74 ***
log 10 (elevation) -0.04 0.05 0.01 ns
See Table 1 for more thorough information on explanatory Factors explaining seabird distribution
variables and abundance on Mediterranean islands
Significance levels: *** (P \ 0.001); ** (P \ 0.01);
*(P \ 0.05); ns not significant
Island area was positively related to Yelkouan and
Balearic shearwater presence, Yelkouan and Cory’s
continent, or presence and intensity of human activ- shearwater abundance (P \ 0.05), and weakly neg-
ities. There was no evidence of model inadequacy atively related to storm petrel presence (P = 0.06;
2
(scaled Pearson v = 219.0; df = 250; P = 0.08). In Tables 3 and 4). Island elevation was positively
order to clarify the negative relationship between rat related to Cory’s and Yelkouan shearwater presence
presence and distance to the nearest potential source and Balearic shearwater and storm petrel abundance.
of rats, we performed Mann–Whitney tests to com- Limestone substrate was positively related to Yelkouan
pare, for islands B5 ha and those [5 ha, mean shearwater abundance and storm petrel presence. Rat
distances from the nearest source of rats (i.e., island presence on islands was negatively related to storm
C5 ha or continent) between rat-free and rat-infested petrel abundance, but did not influence either the
islets. Small rat-infested islets B5 ha were signifi- presence or the abundance of the three shearwaters.
cantly closer from the nearest source of rats than Ship rats are present on most islands where the three
small rat-free islets B5 ha (Mann–Whitney, Z = 3.5; shearwaters breed (Fig. 3). Distance to the nearest
Table 3 Statistical significance of explanatory variables in GLMs on seabird presence (b = estimate; SE = standard error of the
estimate; W = Wald statistic)
Calonectris diomedea Puffinus yelkouan Puffinus mauretanicus Hydrobates pelagicus
Parameters b SE W P- b SE W P- b SE W P- b SE W P-
value value value value
Intercept -4.04 0.99 16.48 *** -8.79 2.23 15.53 *** -3.28 92.73 0.00 ns -6.86 2.12 10.43 ***
log 10 (area) 0.29 0.26 1.27 ns 1.14 0.53 4.56 * 0.89 0.39 5.33 * -0.85 0.45 3.49 0.06
log 10 (elevation) 2.35 0.65 12.92 *** 4.09 1.47 7.74 ** 0.16 0.66 0.06 ns 1.69 1.02 2.74 ns
Substrate 0.08 1.19 0.17 ns 0.34 0.36 0.86 ns 1.92 92.72 0.00 ns 1.38 0.38 14.76 ***
(limestone)
Rats (presence) 0.19 0.25 0.58 ns 0.14 0.63 0.05 ns 0.35 0.27 1.68 ns 0.31 0.39 0.6 ns
log 10 (Dist. near. 0.04 0.26 0.03 ns -0.27 0.44 0.38 ns -0.02 0.52 0.06 ns 1.39 0.50 7.59 **
rats)
N 179 135 69 100
See Table 1 for more thorough information on explanatory variables
Significance levels: *** (P \ 0.001); ** (P \ 0.01); * (P \ 0.05); ns not significant
123