
Page 3 - Isozyme_analysis_of_genetic_diversity2004
P. 3
139
Table 1. Identification, geographical origin and size of Brassica populations investigated.
Identification Taxa Origin Size (number of individuals)
pop1 B. villosa subsp. villosa Monte Calcerame (Sagana) – Palermo 101–500
pop2 B. villosa subsp. bivoniana M. Inici – Trapani 501–1000
pop3 B. villosa subsp. bivoniana Caltabellotta – Agrigento .1000
pop4 B. villosa subsp. drepanensis M. S. Giuliano - Erice - Trapani .1000
pop5 B. villosa subsp. bivoniana C.da Serbatoio (Fontanarossa) - Trapani 11–50
pop6 B. villosa subsp. tinei P.lla Scalazza (Marianopoli)- Caltanissetta 501–1000
pop7 B. rupestris subsp. rupestris M. Pellegrino - Palermo .1000
pop8 B. rupestris subsp. rupestris Rocca Busambra - Palermo .1000
pop9 B. rupestris subsp. rupestris Stilo – Cosenza (Calabria) 51–100
pop10 B. rupestris subsp. rupestris M. Sferrovecchio (S. Ciro) – Palermo 51–100
pop11 B. rupestris subsp. brevisiliqua Capo San Vito (Isolidda) – Trapani 101–500
pop12 B. rupestris subsp. hispida M. Pizzuta - Palermo .1000
pop13 B. rupestris subsp. hispida Cozzo Cicero (Borgetto) - Palermo 51–100
pop14 B. incana Gonato - Madonie - Palermo 101–500
pop15 B. incana Passo della Zita (Longi) - Messina 101–500
pop16 B. macrocarpa M. S. Caterina (Favignana, Isole Egadi) - Trapani 501–1000
Data analysis
For each locus the resulting zymograms were inter-
pretated as allelic frequencies. For all populations
levels of allozyme diversity were estimated. A locus
was considered as polymorphic if the most common
allele was present at the frequency , 0.95 (P 95) or ,
0.99 (P 99).
Wright (1951) fixation (F) index was calculated as
F 5 12Ho/He with Ho, the observed heterozygosity
(percentage of heterozygous for each population and
locus) and He, the expected heterozygosity calculated
from allelic frequencies according to the Hardy-Wein-
berg law. Chi-square test was used to evaluate the
significativity of the deviation from the Hardy-Wein-
berg law.
For each population gene diversity, H, as described
by Nei (1973), was calculated for each polymorphic
locus.
For each polymorphic locus genetic diversity in the
total populations (Ht), mean genetic diversity within
populations (Hs), the average genetic diversity among
populations (Dst) and the relative magnitude of gene
differentiation occurring among populations (Gst)
were calculated (Nei 1973).
Genetic distances among populations were esti-
mated from allelic frequencies (Nei 1972) using
BIOSYS-1 program (Swofford and Selander 1989).
Dendrogram was then computed from the distance
matrices using UPGMA option of the NEIGHBOR
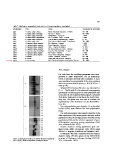
Figure 2. Zymograms of: (a) Pgi-2 (pop8), (b) Pgm-2 (pop9), (c) program of Phylogeny Inference Package (PHYLIP
Lap-1 (pop7). Allelic interpretation of bands is shown. 3.5c., Felsenstein 1993).