
Page 7 - Isozyme_analysis_of_genetic_diversity2004
P. 7
143
rocarpa from the villoso-rupestris group in which a
clear separation of populations at specific and sub-
specific rank was not well detectable.
Discussion
From the analysis of allelic presence in our popula-
tions, 37 alleles were detected. B. rupestris and B.
villosa show a more similar composition whereas B.
incana and B. macrocarpa resulted more distinct and
more differentiated. The presence of six exclusive
alleles was a very important remark because it char-
acterizes the populations.
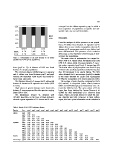
Figure 3. Differentiation of the total diversity in Hs (within
The mean value of polymorphic loci ranged be-
populations) and Dst (among populations).
tween 18% in B. villosa subsp. bivoniana (pop5) and
63% in B. villosa subsp. bivoniana (pop2), B. rupes-
tris subsp. rupestris (pop7) and B. incana (pop14).
tions (pop7 to 13). A distance of 0.22 was found The lowest value of polymorphism was found in pop
between B. incana populations. 5 which is the smallest population studied having less
The minimum distance (0.06) between B. rupestris than 50 individuals in its natural habitat. The 36%
and B. villosa was found between pop13 and pop3 value obtained for B. macrocarpa (pop16) is similar
whereas the maximum value (0.29) was found be- to the result obtained by Lazaro and Aguinagalde
tween pop2 and pop12. (1998a) for a population of B. macrocarpa (36.36%).
The distances between B. incana and B. villosa and The average of gene diversity, computed as Nei’s
between B. incana and B. rupestris were similar (0.29 (H) statistic, is comprised (mean values) between
to 0.51). 0.067 and 0.24 although great fluctuations were de-
High values of genetic distance were found also tected for different loci. The mean values of H are
between B. macrocarpa and the other species, ranging lower than those obtained by Lanner-Herrera et al.
from 0.20 to 0.46. (1996) for wild populations of B. oleracea from
The dendrogram (Figure 4), obtained with Spain, France, and Great Britain for which the aver-
UPGMA algorithm, on the basis of these distances age diversity was 0.40. However, as these authors
showed a great separation of B. incana and B. mac- report, this index gives information on the variation in
Table 6. Matrix of Nei (1972) minimum distance.
Species Item pop1 pop2 pop3 pop4 pop5 pop6 pop7 pop8 pop9 pop10 pop11 pop12 pop13 pop14 pop15
villosa pop2 0.08
pop3 0.17 0.13
pop4 0.19 0.13 0.10
pop5 0.06 0.07 0.18 0.10
pop6 0.26 0.16 0.18 0.16 0.20
rupestris pop7 0.16 0.14 0.14 0.26 0.20 0.23
pop8 0.08 0.09 0.14 0.24 0.11 0.20 0.08
pop9 0.24 0.23 0.16 0.18 0.21 0.11 0.18 0.20
pop10 0.19 0.11 0.09 0.24 0.21 0.16 0.08 0.07 0.19
pop11 0.26 0.14 0.10 0.19 0.25 0.09 0.15 0.16 0.17 0.08
pop12 0.21 0.16 0.17 0.29 0.21 0.21 0.06 0.07 0.16 0.09 0.18
pop13 0.10 0.09 0.06 0.19 0.17 0.21 0.07 0.07 0.18 0.05 0.10 0.11
incana pop14 0.43 0.35 0.33 0.36 0.41 0.39 0.29 0.38 0.33 0.35 0.32 0.36 0.32
pop15 0.51 0.39 0.51 0.47 0.43 0.45 0.49 0.45 0.55 0.45 0.48 0.50 0.50 0.22
macrocarpa pop16 0.26 0.28 0.37 0.43 0.29 0.43 0.26 0.20 0.32 0.34 0.43 0.23 0.30 0.33 0.46