Page 6 - Isozyme_analysis_of_genetic_diversity2004
P. 6

142

               But for all the species, the diversity within popula-  villosa showed a greater diversity within populations
               tions (Hs) was greater than the diversity among  for Lap-1 and B. incana for 6Pgd-1. The loci in-
               populations (Dst) in the same proportion (Figure 3).  volved in the populations differentiation (Gst) were
                 Although, the differentiation in Hs and Dst was  also different: Pgm-2 and Aco-4 for B. villosa and
               similar according to the species, the structure of the  Lap-1 and Pgm-1 for B. incana.
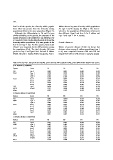
               genetic diversity at the studied loci was different. For
               B. rupestris (Table 5a), the total diversity (Ht) and the
               diversity within populations (Hs) was greater at the  Genetic distances
               Aco-3 and Lap-1 loci. For this species, Pgm-2 and
               6Pgd-1 were important for the differentiation among  Matrix of genetic distance (Table 6), shows that
               the populations (Gst). The total diversity (Ht) was  distance values among B. villosa populations (pop 1
               greater at Lap-1 and Pgm-2 loci for both B. villosa  to 6) were comprised between 0.06 and 0.26 and
               (Table 5b) and B. incana (Table 5c) species. But B.  ranged from 0.05 to 0.20 among B. rupestris popula-


               Table 5. Diversity index: total genetic diversity (Ht), genetic diversity within populations (Hs), genetic dufferentiation (Gst) for each species.
               a) B. rupestris (7 population)
               System            Locus             Ht               Hs                Dst              Gst
               PGI               Pgi-2             0.032            0.029             0.003            0.099
               PGM               Pgm-3             0.020            0.019             0.001            0.049
                                 Pgm-1             0.254            0.152             0.102            0.401
                                 Pgm-2             0.376            0.102             0.274            0.729
               ACO               Aco-1             0.130            0.097             0.033            0.254
                                 Aco-2             0.397            0.274             0.123            0.311
                                 Aco-3             0.610            0.432             0.178            0.292
                                 Aco-4             0.276            0.228             0.047            0.172
               LAP               Lap-1             0.620            0.387             0.233            0.376
               6PGD              6Pgd-1            0.157            0.068             0.088            0.562
               Mean                                0.287            0.178             0.108            0.324
               b) Brassica villosa (6 populations)
               System            Locus             Ht               Hs                Dst              Gst
               PGI               Pgi-2             0.083            0.0641            0.019            0.226
               PGM               Pgm-1             0.332            0.265             0.067            0.201
                                 Pgm-2             0.499            0.238             0.261            0.522
               ACO               Aco-1             0.393            0.219             0.174            0.442
                                 Aco-2             0.455            0.239             0.217            0.476
                                 Aco-3             0.248            0.188             0.060            0.243
                                 Aco-4             0.472            0.238             0.233            0.494
               LAP               Lap-1             0.650            0.383             0.267            0.411
               Mean                                0.391            0.229             0.162            0.377
               c) Brassica incana (2 populations)
               System            Locus             Ht               Hs                Dst              Gst
               PGI               Pgi-2             0.311            0.237             0.074            0.239
               PGM               Pgm-1             0.485            0.142             0.343            0.706
                                 Pgm-2             0.582            0.356             0.226            0.389
               ACO               Aco-2             0.029            0.028             0.001            0.015
                                 Aco-3             0.375            0.250             0.125            0.333
                                 Aco-4             0.082            0.078             0.004            0.055
               LAP               Lap-1             0.519            0.107             0.412            0.793
               6PGD              6Pgd-1            0.492            0.455             0.037            0.075
                                 6Pgd-2            0.169            0.151             0.017            0.102
               Mean                                0.338            0.200             0.138            0.300
   1   2   3   4   5   6   7   8   9   10