
Page 6 - Orecchio_alii_2008
P. 6
Author's personal copy
ARTICLE IN PRESS
376 S. Orecchio et al. / Environmental Research 107 (2008) 371–379
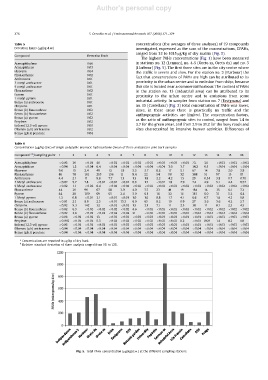
Table 5 concentrations (the averages of three analyses) of 19 compounds
Detection limits (mg/kg d.w.) investigated, expressed as the sum of the concentrations, SPAHs,
ranged from 33 to 1015 mg/kg of dry matrix (Fig. 5).
Compound Detection limit
The highest PAHs concentrations (Fig. 1) have been measured
Acenaphthylene 0.60 in stations no. 12 (Lennon), no. 4-5 (Oreto sx, Oreto dx) and no. 3
Acenaphthene 0.03 (Harbour) (Fig. 5). The first three sites are in the city centre where
Fluorene 0.04 the traffic is severe and slow. For the station no. 3 (Harbour) the
Phenanthrene 0.02
Anthracene 0.01 fact that concentrations of PAHs are high can be attributed to its
2 metyl anthracene 0.01 proximity to the urban centre and to emission from ships, because
9 metyl anthracene 0.01 this site is located near a commercial harbour. The content of PAHs
Fluoranthene 0.02 in the station no. 13 (Industrial area) can be attributed to its
Pyrene 0.01 proximity to the urban centre and to emissions from some
1 metyl pyrene 0.01
Benzo (a) anthracene 0.01 industrial activity. In samples from station no. 7 (Favignana) and
Chrysene 0.01 no. 15 (Castellana) (Fig. 2) total concentration of PAHs was lower,
Benzo (b) fluoranthene 0.02 since, in these areas there is practically no traffic and the
Benzo (k) fluoranthene 0.02 anthropogenic activities are limited. The concentration factors,
Benzo (a) pyrene 0.02
Perylene 0.02 as the ratio of anthropogenic sites to control, ranged from 1.4 to
Indeno(1.2.3-cd) pyrene 0.00 3.7 for the green areas, and from 2.9 to 31.2 for the busy roads and
Dibenzo (a.h) anthracene 0.02 sites characterized by intensive human activities. Differences of
Benzo (g.h.i) perylene 0.04
Table 6
Concentration (mg/kg d.w.) of single polycyclic aromatic hydrocarbons (mean of three analysis) in pine bark samples
Compound a,b /sampling point 1 2 3 4 5 6 7 8 9 10 11 12 13 14 15 16
Acenaphthylene o0.03 30 o0.03 40 o0.03 o0.03 o0.03 o0.03 o0.03 o0.03 o0.03 73. 34 o0.03 o0.03 o0.03
Acenaphthene o0.04 1.2 o0.04 6.4 o0.04 o0.04 o0.04 o0.04 o0.04 3.0 3.7 14.2 0.5 o0.04 o0.04 o0.04
Fluorene 9.0 15 2.4 49 13 1.9 3.5 3.7 8.2 17 5.1 67 14 7.8 3.0 3.9
Phenanthrene 86 78 101 210 136 11 8.4 22 54 98 32 388 51 97 15 17
Anthracene 4.4 2.1 11 9.8 7.7 1.3 1.3 1.8 2.2 4.2 1.5 29 0.54 3.8 0.7 0.70
2 Metyl anthracene o0.02 5.7 7.8 o0.02 o0.02 o0.02 0.9 1.7 o0.02 1.8 2.9 7.4 4.9 5.1 4.4 0.52
9 Metyl anthracene o0.02 1.1 o0.02 6.4 o0.02 o0.02 o0.02 o0.02 o0.02 o0.02 o0.02 o0.02 o0.02 o0.02 o0.02 o0.02
Fluoranthene 44 30 90 67 58 3.0 4.0 7.7 23 41 19 184 14 35 6.1 7.3
Pyrene 44 28 100 69 65 2.4 3.0 6.1 16 32 16 181 6.0 31 5.2 6.4
1 Metyl pyrene 1.3 0.8 o0.01 3.1 o0.01 o0.01 1.0 1.0 0.8 1.7 4.1 6.6 0.7 1.6 4.2 1.0
Benzo (a) anthracene o0.01 2.1 8.9 2.5 o0.01 13.3 6.0 65 8.2 19 0.9 27 3.6 3.6 4.2 2.7
Chrysene o0.02 5.3 142 32 o0.02 o0.02 1.5 3.1 7.1 11 2.5 38 11 8.1 2.3 4.5
Benzo (b) fluoranthene o0.02 6.3 o0.02 o0.02 o0.02 o0.02 4.6 o0.02 o0.02 o0.02 o0.02 o0.02 o0.02 o0.02 o0.02 o0.02
Benzo (k) fluoranthene o0.02 2.6 o0.02 o0.02 o0.02 o0.02 31 o0.02 o0.02 o0.02 o0.02 o0.02 o0.02 o0.02 o0.02 o0.02
Benzo (a) pyrene o0.03 o0.03 o0.03 13 o0.03 o0.03 o0.03 o0.03 o0.03 o0.03 o0.03 o0.03 o0.03 o0.03 o0.03 o0.03
Perylene o0.002 o0.02 o0.02 5.3 o0.02 o0.02 o0.02 o0.02 o0.02 o0.02 8.2 o0.02 86.9 1.4 8.2 1.8
Indeno(1.2.3-cd) pyrene o0.03 o0.03 o0.03 o0.03 o0.03 o0.03 o0.03 o0.03 o0.03 o0.03 o0.03 o0.03 o0.03 o0.03 o0.03 o0.03
Dibenzo (a.h) anthracene o0.04 o0.04 o0.04 o0.04 o0.04 o0.04 o0.04 o0.04 o0.04 o0.04 o0.04 o0.04 o0.04 o0.04 o0.04 o0.04
Benzo (g.h.i) perylene o0.04 o0.04 o0.04 o0.04 o0.04 o0.04 o0.04 o0.04 o0.04 o0.04 o0.04 o0.04 o0.04 o0.04 o0.04 o0.04
a
Concentration are reported in mg/kg of dry bark.
b
Relative standard deviation of three analysis ranged from 5% to 12%.
Fig. 5. Total PAHs concentration (mg/kg/d.w.) at the different sampling stations.