
Page 10 - Renaud_Michaux_2007
P. 10
S. Renaud and J. R. Michaux
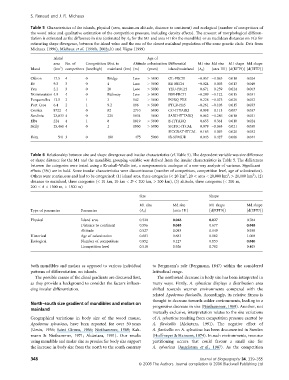
Table 5 Characteristics of the islands, physical (area, maximum altitude, distance to continent) and ecological (number of competitors of
the wood mice and qualitative estimation of the competition pressure, including density effects). The amount of morphological differen-
tiation is estimated as the difference in size (estimated by A 0 for the M1 and area H1 for the mandible) or as Euclidean distances on FCs for
estimating shape divergence, between the island value and the one of the closest mainland population of the same genetic clade. Data from
Michaux (1996), Michaux et al. (1996b, 2002a,b) and Vigne (1999)
Island Age of
area No. of Competition Dist. to Altitude colonization Differential M1 size Md size M1 shape Md shape
2
Island (km ) competitors (low/high) mainland (km) (m) (years) island/mainland (A 0 ) (area H1) [d(RFT9)] [d(EFT7)]
Ole ´ron 17.5 4 0 Bridge Low > 5000 OL-FRCH )0.057 )0.063 0.018 0.024
Re ´ 9.3 3 0 4 Low > 5000 RE-FRCH )0.024 0.003 0.013 0.040
Yeu 2.2 3 0 20 Low > 5000 YEU-FRCH 0.671 0.259 0.024 0.063
Noirmoutiers 4.9 4 0 Pathway Low > 5000 NM-FRCH )0.289 )0.122 0.015 0.031
Porquerolles 12.5 2 1 3 142 > 5000 PORQ-FRS 0.228 )0.073 0.020 0.032
Port Cros 6.4 2 1 9.2 196 > 5000 PTCR-FRS )0.261 )0.103 0.015 0.033
Corsica 8722 4 0 82 2710 5000 CO-ITTARQ 0.098 0.113 0.007 0.037
Sardinia 23,833 4 0 220 1834 5000 SARD-ITTARQ 0.062 )0.286 0.018 0.021
Elba 224 4 1 8 1019 > 5000 E-ITTARQ 0.655 0.361 0.010 0.024
Sicily 25,460 4 0 2 1950 > 5000 SICFIC-ITCAL 0.079 )0.063 0.021 0.038
SICGRAT-ITCAL 0.163 )0.093 0.020 0.032
Ibiza 541 3 0 180 475 5000 IB-SPMUR 0.043 0.427 0.006 0.044
Table 6 Relationship between size and shape divergence and insular characteristics (cf. Table 5). The dependent variable was size difference
or shape distance for the M1 and the mandible; grouping variable was derived from the insular characteristics in Table 5. The differences
between the categories were tested using a Kruskall–Wallis test, a nonparametric analogue of a one-way analysis of variance. Significant
effects (5%) are in bold. Some insular characteristics were discontinuous (number of competitors, competition level, age of colonization).
2
2
2
Others were continuous and had to be categorised: (1) island area, three categories (< 20 km , 20 < area < 20,000 km , > 20,000 km ), (2)
distance to mainland, three categories (< 10 km, 10 km < D < 200 km, > 200 km), (3) altitude, three categories (< 200 m,
200 < A < 1500 m, > 1500 m)
Size Shape
M1 size Md size M1 shape Md shape
Type of parameter Parameter (A 0 ) (area H1) [d(RFT9)] [d(EFT7)]
Physical Island area 0.520 0.048 0.027 0.784
Distance to continent 0.596 0.048 0.677 0.048
Altitude 0.527 0.093 0.149 0.938
Historical Age of colonization 0.683 0.683 0.102 1.000
Ecological Number of competitors 0.952 0.127 0.853 0.040
Competition level 0.518 0.926 0.782 0.405
both mandibles and molars as opposed to various individual to Bergmann’s rule (Bergmann, 1847) within the considered
patterns of differentiation on islands. latitudinal range.
The possible causes of the clinal gradients are discussed first, The northward decrease in body size has been interpreted in
as they provide a background to consider the factors influen- many ways. Firstly, A. sylvaticus displays a distribution area
cing insular differentiation. shifted towards warmer environments compared with the
related Apodemus flavicollis. Accordingly, its relative fitness is
thought to decrease towards colder environments, leading to a
North–south size gradient of mandibles and molars on
progressive decrease in size (Niethammer, 1969). Another, not
mainland
mutually exclusive, interpretation relates to the size variations
Geographical variations in body size of the wood mouse, of A. sylvaticus resulting from competition pressure exerted by
Apodemus sylvaticus, have been reported for over 50 years A. flavicollis (Alca `ntara, 1991). The negative effect of
(Ursin, 1956; Saint Girons, 1966; Niethammer, 1969; Kah- A. flavicollis on A. sylvaticus has been documented in Sweden
mann & Niethammer, 1971; Alca `ntara, 1991). Our results (Hoffmeyer & Hansson, 1974). In such environments, resource
using mandible and molar size as proxies for body size support partitioning occurs that could favour a small size for
the increase in body size from the north to the south contrary A. sylvaticus (Angelstam et al., 1987). As the competition
348 Journal of Biogeography 34, 339–355
ª 2006 The Authors. Journal compilation ª 2006 Blackwell Publishing Ltd