
Page 4 - Reverse_osmosis2016
P. 4
186 S. Casimiro et al. / Desalination and Water Treatment 61 (2017) 183–195
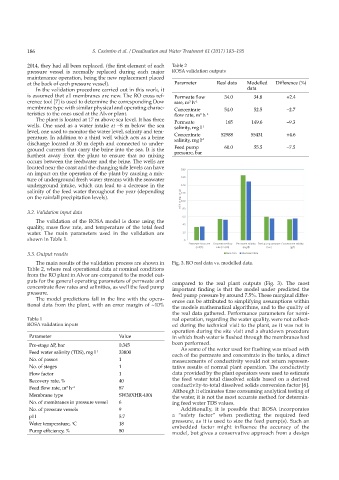
2014, they had all been replaced. (the first element of each Table 2
pressure vessel is normally replaced during each major ROSA validation outputs
maintenance operation, being the new replacement placed
at the back of each pressure vessel). Parameter Real data Modelled Difference (%)
In the validation procedure carried out in this work, it data
is assumed that all membranes are new. The RO cross ref- Permeate flow 34.0 34.8 +2.4
erence tool [7] is used to determine the corresponding Dow rate, m h –1
3
membrane type with similar physical and operating charac- Concentrate 54.0 52.5 –2.7
teristics to the ones used at the Alvor plant. flow rate, m h –1
3
The plant is located at 17 m above sea level. It has three Permeate 165 149.6 –9.3
wells. One used as a water intake at –8 m below the sea salinity, mg l –1
level, one used to monitor the water level, salinity and tem-
perature. In addition to a third well which acts as a brine Concentrate –1 52988 55431 +4.6
salinity, mg l
discharge located at 30 m depth and connected to under-
ground currents that carry the brine into the sea. It is the Feed pump 60.0 55.5 –7.5
furthest away from the plant to ensure that no mixing pressure, bar
occurs between the feedwater and the brine. The wells are
located near the coast and the changing tide levels can have
an impact on the operation of the plant by causing a mix-
ture of underground fresh water streams with the seawater
underground intake, which can lead to a decrease in the
salinity of the feed water throughout the year (depending
on the rainfall precipitation levels).
3.2. Validation input data
The validation of the ROSA model is done using the
quality, mass flow rate, and temperature of the total feed
water. The main parameters used in the validation are
shown in Table 1.
3.3. Output results
The main results of the validation process are shown in Fig. 3. RO real data vs. modelled data.
Table 2, where real operational data at nominal conditions
from the RO plant in Alvor are compared to the model out-
puts for the general operating parameters of permeate and compared to the real plant outputs (Fig. 3). The most
concentrate flow rates and salinities, as well the feed pump important finding is that the model under predicted the
pressure. feed pump pressure by around 7.5%. These marginal differ-
The model predictions fall in the line with the opera- ences can be attributed to simplifying assumptions within
tional data from the plant, with an error margin of ~10% the models mathematical algorithms, and to the quality of
the real data gathered. Performance parameters for nomi-
Table 1 nal operation, regarding the water quality, were not collect-
ROSA validation inputs ed during the technical visit to the plant, as it was not in
operation during the site visit and a shutdown procedure
Parameter Value in which fresh water is flushed through the membranes had
Pre-stage ΔP, bar 0.345 been performed.
As some of the water used for flushing was mixed with
Feed water salinity (TDS), mg l –1 33800 each of the permeate and concentrate in the tanks, a direct
No. of passes 1 measurements of conductivity would not return represen-
No. of stages 1 tative results of normal plant operation. The conductivity
Flow factor 1 data provided by the plant operators were used to estimate
Recovery rate, % 40 the feed water total dissolved solids based on a derived
Feed flow rate, m h –1 87 conductivity-to-total dissolved solids conversion factor [6].
3
Although it eliminates time consuming analytical testing of
Membrane type SW30XHR-400i the water, it is not the most accurate method for determin-
No. of membranes in pressure vessel 6 ing feed water TDS values.
No. of pressure vessels 9 Additionally, it is possible that ROSA incorporates
pH 5.7 a “safety factor” when predicting the required feed
Water temperature, C 18 pressure, as it is used to size the feed pump(s). Such an
o
embedded factor might influence the accuracy of the
Pump efficiency, % 80 model, but gives a conservative approach from a design