
Page 6 - Reverse_osmosis2016
P. 6
188 S. Casimiro et al. / Desalination and Water Treatment 61 (2017) 183–195
will maintain a stable temperature difference between the near the plant without extensive maritime works to build
saturated vapor pressure and the cooling water tempera- an intake for the collection of cooler water into the plant. It
ture outlet (this second option was used when simulating is important to note that the computer code developed for
the CSP+ SWCC, operating with a variable vapor pressure the once through cooling system was initially made for the
to optimize the plant’s performance). assessment of CSP+MED. When using this configuration
It was defined that the CSP-RO system operates in a way the condenser is “cooled down” with sensible heat transfer
that ensures that, in both full and partial operation of the from the cooling water, and so using cooling water with a
o
CSP plant, each train is operated either at 100% capacity or few C lower has a bigger impact on the plant performance.
it is shut down, depending on availability of power under Because of the reasons mentioned above, in this work it
different water temperatures across the simulation period was considered that it would be neglected the power con-
(one year). Pumping costs of the seawater from the intake sumption to pump cooling water from the sea up to the wet
to the high pressure pump of the RO system are accounted cooling system, while the calculations when using a once
for in this work. A minimum start-up and shutdown times through cooling circuit would account for that.
are set for: the whole intake/outfall and pretreatment sys- It should be noted that both the CSP and the MED mod-
tems; and RO trains separately. The water temperatures are els do not account for differences in the performance of sim-
o
expected to range yearly within 10–22 C. A constant per- ilar power blocks or MED trains, when the only difference is
meate flow in the RO trains is maintained by adjusting the the installed capacity.
feed pressure according to temperature in a way that keeps It is being assumed co-location of the CSP and RO
the same ratio of permeate flow against feed flow during plants. Though, the intake for the RO is considered to be an
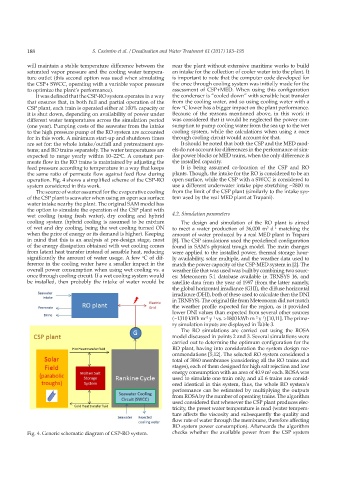
operation. Fig. 4 shows a simplified scheme of the CSP-RO open surface, while the CSP with a SWCC is considered to
system considered in this work. use a different underwater intake pipe stretching ~2800 m
The source of water assumed for the evaporative cooling from the limit of the CSP plant (similarly to the intake sys-
of the CSP plant is seawater when using an open sea surface tem used by the real MED plant at Trapani).
water intake nearby the plant. The original SAM model has
the option to simulate the operation of the CSP plant with
wet cooling (using fresh water), dry cooling and hybrid 4.2. Simulation parameters
cooling system (hybrid cooling is assumed to be mixture The design and simulation of the RO plant is aimed
of wet and dry cooling, being the wet cooling turned ON to meet a water production of 36,000 m d matching the
3
–1
when the price of energy or its demand is higher). Keeping amount of water produced by a real MED plant in Trapani
in mind that this is an analysis at pre-design stage, most [8]. The CSP simulations used the predefined configuration
of the energy dissipation obtained with wet cooling comes found in SAM’s physical trough model. The main changes
from latent heat transfer instead of sensible heat, reducing were applied to the installed power, thermal storage hour-
significantly the amount of water usage. A few C of dif- ly availability, solar multiple, and the weather data used to
o
ference in the cooling water have a smaller impact in the match the power capacity of the CSP-MED system in [2]. The
overall power consumption when using wet cooling vs. a weather file that was used was built by combining two sourc-
once through cooling circuit. If a wet cooling system would es: Meteonorm 5.1 database available in TRNSYS 16, and
be installed, then probably the intake of water would be satellite data from the year of 1997 (from the latter namely,
the global horizontal irradiance (GHI), the diffuse horizontal
irradiance (DHI), both of these used to calculate then the DNI
in TRNSYS). The original file from Meteonorm did not match
the weather profile expected for the region, as it provided
lower DNI values than expected from several other sources
–2
(~1310 kWh m y vs. >1800 kWh m y ) [10,11]. The prima-
–2
–1
–1
ry simulation inputs are displayed in Table 3.
The RO simulations are carried out using the ROSA
model discussed in points 2 and 3. Several simulations were
carried out to determine the optimum configuration for the
RO plant, having into consideration the system design rec-
ommendations [5,12]. The selected RO system considered a
total of 3060 membranes (considering all the RO trains and
stages), each of them designed for high salt rejection and low
energy consumption with an area of 40.9 m each. ROSA was
2
used to simulate one train only, and all 6 trains are consid-
ered identical in this system, thus, the whole RO system’s
performance can be estimated by multiplying the outputs
from ROSA by the number of operating trains. The algorithm
used considered that whenever the CSP plant produces elec-
tricity, the preset water temperature is read (water tempera-
ture affects the viscosity and subsequently the quality and
flow rate of water through the membrane, therefore affecting
RO system power consumption). Afterwards the algorithm
Fig. 4. Generic schematic diagram of CSP-RO system. checks whether the available power from the CSP system