
Page 11 - Reverse_osmosis2016
P. 11
S. Casimiro et al. / Desalination and Water Treatment 61 (2017) 183–195 193
designed to absorb the total amount of rejected heat by the
CSP plant at design conditions. The reason why this was
done was because this would enable the operation of the
CSP plant independently of the MED, which might be an
advantage especially for the first systems to be built with
CSP+MED, as mistakes with the startup and shut down of
the MED plant may occur easily with the intermittency of
the CSP plant. Also the simulation of the CSP+MED system
assumed that during startup of the MED the dissipation of
heat is done by the SWCC. This is a simplification, as in
reality part of the steam leaving the CSP plant would be
increasingly directed to the MED plant until it would reach
the required level of operation. Also, the water produced by
the MED plant during startup might not be of good quality,
so it is not accounted when considering the total water pro-
duced by the MED.
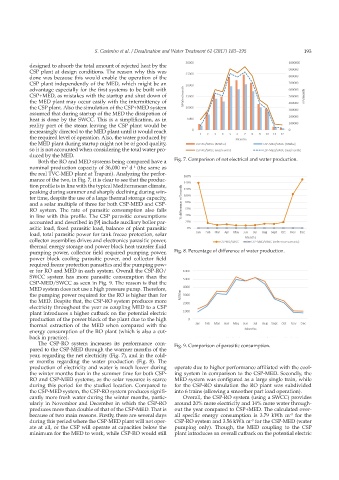
Both the RO and MED systems being compared have a Fig. 7. Comparison of net electrical and water production.
nominal production capacity of 36,000 m d (the same as
3
–1
the real TVC-MED plant at Trapani). Analyzing the perfor-
mance of the two, in Fig. 7, it is clear to see that the produc-
tion profile is in line with the typical Mediterranean climate,
peaking during summer and sharply declining during win-
ter time, despite the use of a large thermal storage capacity,
and a solar multiple of three for both CSP-MED and CSP-
RO system. The rate of parasitic consumption also falls
in line with this profile. The CSP parasitic consumptions
accounted and described in [9] include auxiliary boiler par-
asitic load, fixed parasitic load, balance of plant parasitic
load, total parasitic power for tank freeze protection, solar
collector assemblies drives and electronics parasitic power,
thermal energy storage and power block heat transfer fluid
pumping power, collector field required pumping power, Fig. 8. Percentage of difference of water production.
power block cooling parasitic power, and collector field
required freeze protection parasitics and the pumping pow-
er for RO and MED in each system. Overall the CSP-RO/
SWCC system has more parasitic consumption than the
CSP-MED/SWCC as seen in Fig. 9. The reason is that the
MED system does not use a high pressure pump. Therefore,
the pumping power required for the RO is higher than for
the MED. Despite that, the CSP-RO system produces more
electricity throughout the year as coupling MED to a CSP
plant introduces a higher cutback on the potential electric
production of the power block of the plant due to the high
thermal extraction of the MED when compared with the
energy consumption of the RO plant (which is also a cut-
back in practice).
The CSP-RO system increases its performance com- Fig. 9. Comparison of parasitic consumption.
pared to the CSP-MED through the warmer months of the
year, regarding the net electricity (Fig. 7), and in the cold-
er months regarding the water production (Fig. 8). The
production of electricity and water is much lower during operate due to higher performance affiliated with the cool-
the winter months than in the summer time for both CSP- ing system in comparison to the CSP-MED. Secondly, the
RO and CSP-MED systems, as the solar resource is scarce MED system was configured as a large single train, while
during this period for the studied location. Compared to for the CSP-RO simulation the RO plant was subdivided
the CSP-MED system, the CSP-RO system produces signifi- into 6 trains (allowing a smoother part load operation).
cantly more fresh water during the winter months, partic- Overall, the CSP-RO system (using a SWCC) provides
ularly in November and December in which the CSP-RO around 20% more electricity and 14% more water through-
produces more than double of that of the CSP-MED. That is out the year compared to CSP+MED. The calculated over-
because of two main reasons. Firstly, there are several days all specific energy consumption is 3.79 kWh m for the
–3
during this period where the CSP-MED plant will not oper- CSP-RO system and 3.56 kWh m for the CSP-MED (water
–3
ate at all, or the CSP will operate at capacities below the pumping only). Though, the MED coupling to the CSP
minimum for the MED to work, while CSP-RO would still plant introduces an overall cutback on the potential electric