
Page 10 - Reverse_osmosis2016
P. 10
192 S. Casimiro et al. / Desalination and Water Treatment 61 (2017) 183–195
production (~156,700 MWh y ) and were almost insepara-
–1
e
ble in performance. Using saltwater might be costly in the
long run as it can cause faster degradation of plant com-
ponents [13] (when comparing a wet cooling system using
freshwater vs. salt water). When comparing the cooling tem-
peratures provided by the wet cooling system vs. the once-
through, the once-through system provided lower tempera-
tures during the warmer months, but warmer temperatures
during the colder months. A shorter intake system to the
plant could eventually ensure better performance of the
once-through system, though it would be dependent on the
temperature of the water it could obtain at shallower depths.
Dry cooling is the worst in terms of power output, as it relies
on the dry bulb temperature, which implies higher tempera-
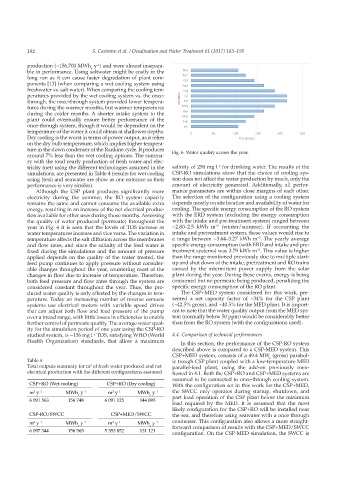
ture in the down condenser of the Rankine cycle. It produces Fig. 6. Water quality across the year.
around 7% less than the wet cooling options. The summa-
ry with the total yearly production of fresh water and elec-
tricity (net) using the different technologies assumed in the salinity of 250 mg l for drinking water. The results of the
–1
simulations, are presented in Table 4 (results for wet cooling CSP-RO simulations show that the choice of cooling sys-
using fresh and seawater are show as one entrance as their tem does not affect the water production by much, only the
performance is very similar). amount of electricity generated. Additionally, all perfor-
Although the CSP plant produces significantly more mance parameters are within close margins of each other.
electricity during the summer, the RO system capacity The selection of the configuration using a cooling system
remains the same and cannot consume the available extra depends mostly on site location and availability of water for
energy, resulting in an increase of the net electrical produc- cooling. The specific energy consumption of the RO system
tion available for other uses during those months. Assessing with the ERD system (excluding the energy consumption
the quality of water produced (permeate) throughout the with the intake and pre-treatment system) ranged between
–3
year in Fig. 6 it is seen that the levels of TDS increase as ~2.80–2.5 kWh m (winter/summer). If accounting the
water temperatures increase and vice versa. The variation in intake and pretreatment system, these values would rise to
temperature affects the salt diffusion across the membranes a range between ~3.64–3.27 kWh m . The yearly average
–3
and flow rates, and since the salinity of the feed water is specific energy consumption (with ERD and intake and pre-
fixed during the simulations and the amount of pressure treatment systems) was 3.79 kWh m . This value is higher
–3
applied depends on the quality of the water treated, the than the range mentioned previously due to multiple start-
feed pump continues to apply pressure without consider- up and shut down of the intake, pretreatment and RO trains
able changes throughout the year, countering most of the caused by the intermittent power supply from the solar
changes in flow due to increase of temperature. Therefore, plant during the year. During these events, energy is being
both feed pressure and flow rates through the system are consumed but no permeate being produced, penalizing the
considered constant throughout the year. Thus, the pro- specific energy consumption of the RO plant.
duced water quality is only affected by the changes in tem- The CSP+MED system considered for this work, pre-
perature. Today an increasing number of reverse osmosis sented a net capacity factor of ~34% for the CSP plant
systems use electrical motors with variable speed drives (~42.5% gross), and ~40.5% for the MED plant. It is import-
that can adjust both flow and feed pressure of the pump ant to note that the water quality output from the MED sys-
over a broad range, with little losses in efficiencies to enable tem (normally below 50 ppm) would be considerably better
further control of permeate quality. The average water qual- than from the RO system (with the configurations used).
ity for the simulation period of one year using the CSP-RO
studied system, is ~156 mg l TDS, satisfying WHO (World 4.4. Comparison of technical performances
–1
Health Organization) standards, that allow a maximum In this section, the performance of the CSP-RO system
described above is compared to a CSP-MED system. This
CSP+MED system, consists of a 49.4 MW (gross) parabol-
e
Table 4 ic trough CSP plant coupled with a low-temperature MED
3
Total outputs summary for m of fresh water produced and net parallel-feed plant, using the add-on previously men-
electrical production with the different configurations assumed tioned in 4.1. Both the CSP+RO and CSP+MED systems are
assumed to be connected to once-through cooling system.
CSP+RO (Wet cooling) CSP+RO (Dry cooling) With the configuration set in this work for the CSP+MED,
m y –1 MWh y –1 m y –1 MWh y –1 the SWCC only operates during startup, shutdown, and
3
3
e e part load operation of the CSP plant below the minimum
6 091 563 156 748 6 091 125 144 895
load required by the MED. It is assumed that the most
likely configuration for the CSP+RO will be installed near
CSP-RO/SWCC CSP+MED/SWCC the sea, and therefore using seawater with a once through
3
3
m y –1 MWh y –1 m y –1 MWh y –1 condenser. This configuration also allows a more straight-
e e forward comparison of results with the CSP+MED/SWCC
6 097 344 156 565 5 353 852 131 121
configuration. On the CSP-MED simulation, the SWCC is