
Page 12 - Reverse_osmosis2016
P. 12
194 S. Casimiro et al. / Desalination and Water Treatment 61 (2017) 183–195
–3
production of the CSP plant equivalent to 9.07 kWh m Comparing the production of both systems (CSP+RO
(considering the net power produced for the Trapani case and CSP+MED) it is clear that to operate the desalination
study), while for the CSP+RO system this cutback is equal plants near nominal capacity similarly to the real commer-
to the specific power consumption of the entire RO plant cial plant at Trapani, these co-generation systems would
–3
(the same 3.79 kWh m ). need to be significantly oversized to more than 2 times the
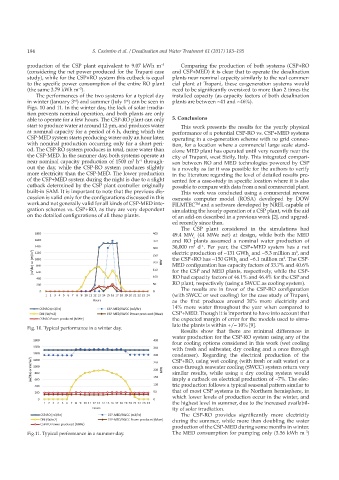
The performances of the two systems for a typical day installed capacity (as capacity factors of both desalination
rd
in winter (January 3 ) and summer (July 1 ) can be seen in plants are between ~41 and ~46%).
st
Figs. 10 and 11. In the winter day, the lack of solar irradia-
tion prevents nominal operation, and both plants are only
able to operate for a few hours. The CSP-RO plant can only 5. Conclusions
start to produce water at around 12 pm, and produces water This work presents the results for the yearly physical
at nominal capacity for a period of 6 h, during which the performance of a potential CSP-RO vs. CSP+MED systems
CSP-MED system starts producing water only an hour later, operating in a co-generation scheme with no grid connec-
with nominal production occurring only for a short peri- tion, for a location where a commercial large scale stand-
od. The CSP-RO system produces in total, more water than alone MED plant has operated until very recently near the
the CSP-MED. In the summer day, both systems operate at city of Trapani, west Sicily, Italy. This integrated compari-
3
near nominal capacity production of 1500 m h through- son between RO and MED technologies powered by CSP
–1
out the day, while the CSP-RO system produces slightly is a novelty as far it was possible for the authors to verify
more electricity than the CSP-MED. The lower production in the literature regarding the level of detailed results pre-
of the CSP+MED system during the night is due to a slight sented for a case-study in specific location where it is also
cutback determined by the CSP plant controller originally possible to compare with data from a real commercial plant.
built-in SAM. It is important to note that the previous dis- This work was conducted using a commercial reverse
cussion is valid only for the configurations discussed in this osmosis computer model (ROSA) developed by DOW
work and not generally valid for all kinds of CSP-MED inte- FILMTEC TM and a software developed by NREL capable of
gration schemes vs. CSP+RO, as they are very dependent simulating the hourly operation of a CSP plant, with the aid
on the detailed configurations of all these plants. of an add-on described in a previous work [2], and upgrad-
ed recently since then.
The CSP plant considered in the simulations had
49.4 MW (44 MWe net) at design, while both the MED
e
and RO plants assumed a nominal water production of
3
36,000 m d . Per year, the CSP+MED system has a net
–1
electric production of ~131 GWh and ~5.3 million m , and
3
e
the CSP+RO has ~150 GWh and ~6.1 million m . The CSP-
3
e
MED configuration has capacity factors of 33.7% and 40.6%
for the CSP and MED plants, respectively, while the CSP-
RO had capacity factors of 46.1% and 46.4% for the CSP and
RO plant, respectively (using a SWCC as cooling system).
The results are in favor of the CSP-RO configuration
(with SWCC or wet cooling) for the case study of Trapani,
as the first produces around 20% more electricity and
14% more water throughout the year when compared to
CSP+MED. Though it is important to have into account that
the expected margin of error for the models used to simu-
late the plants is within +/– 10% [9].
Fig. 10. Typical performance in a winter day.
Results show that there are minimal differences in
water production for the CSP-RO system using any of the
four cooling options considered in this work (wet cooling
with fresh and saltwater, dry cooling and a once through
condenser). Regarding the electrical production of the
CSP+RO, using wet cooling (with fresh or salt water) or a
once-through seawater cooling (SWCC) system return very
similar results, while using a dry cooling system would
imply a cutback on electrical production of ~7%. The elec-
tric production follows a typical seasonal pattern similar to
that of most CSP systems in the Northern hemisphere, in
which lower levels of production occur in the winter, and
the highest level in summer, due to the increased availabil-
ity of solar irradiation.
The CSP-RO provides significantly more electricity
during the summer, while more than doubling the water
production of the CSP-MED during some months in winter.
–3
Fig.11. Typical performance in a summer day. The MED consumption for pumping only (3.56 kWh m )