
Page 6 - THE_ISLAND_RULE_2012
P. 6
1736 P. RAIA AND S. MEIRI
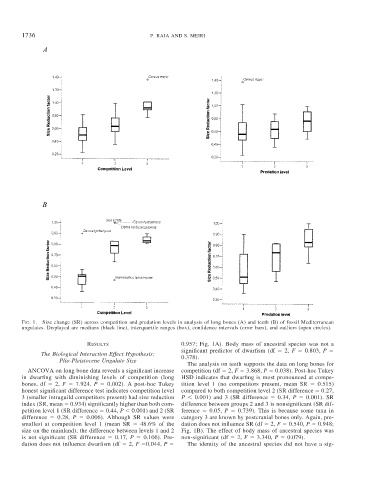
FIG. 1. Size change (SR) across competition and predation levels in analysis of long bones (A) and teeth (B) of fossil Mediterranean
ungulates. Displayed are medians (black line), interquartile ranges (box), confidence intervals (error bars), and outliers (open circles).
RESULTS 0.957; Fig. 1A). Body mass of ancestral species was not a
significant predictor of dwarfism (df 2, F 0.803, P
The Biological Interaction Effect Hypothesis: 0.378).
Plio-Pleistocene Ungulate Size
The analysis on teeth supports the data on long bones for
ANCOVA on long bone data reveals a significant increase competition (df 2, F 3.868, P 0.038). Post-hoc Tukey
in dwarfing with diminishing levels of competition (long HSD indicates that dwarfing is most pronounced at compe-
bones, df 2, F 7.924, P 0.002). A post-hoc Tukey tition level 1 (no competitors present, mean SR 0.515)
honest significant difference test indicates competition level compared to both competition level 2 (SR difference 0.27,
3 (smaller intraguild competitors present) had size reduction P 0.001) and 3 (SR difference 0.34, P 0.001). SR
index (SR, mean 0.934) significantly higher than both com- difference between groups 2 and 3 is nonsignificant (SR dif-
petition level 1 (SR difference 0.44, P 0.001) and 2 (SR ference 0.05, P 0.739). This is because some taxa in
difference 0.28, P 0.006). Although SR values were category 3 are known by postcranial bones only. Again, pre-
smallest at competition level 1 (mean SR 48.6% of the dation does not influence SR (df 2, F 0.540, P 0.948;
size on the mainland), the difference between levels 1 and 2 Fig. 1B). The effect of body mass of ancestral species was
is not significant (SR difference 0.17, P 0.106). Pre- non-significant (df 2, F 3.340, P 0.079).
dation does not influence dwarfism (df 2, F 0.044, P The identity of the ancestral species did not have a sig-