
Page 7 - THE_ISLAND_RULE_2012
P. 7
THE ISLAND RULE IN LARGE MAMMALS 1737
TABLE 3. Results of regression analyses of insular M 3 length (upper) and humerus length (lower) on the respective mainland lengths.
Species were partitioned per competition level (CL).
95% CI
Coefficients
CL slope lower bound upper bound F R 2 P
CL1 intercept 0.002 0.347 0.343
mainland M 3 lengths 0.863 0.696 1.030 148.867 0.955 0.001
CL2 intercept 0.083 0.305 0.139
mainland M 3 lengths 0.966 0.852 1.080 365.687 0.976 0.001
CL3 intercept 0.165 9.627 9.956
mainland M 3 lengths 0.853 5.338 7.045 3.065 0.714 0.330
Dependent variable: island M 3 lengths
95% CI for B
Coefficients
CL B lower bound upper bound F R 2 P
CL1 intercept 0.939 0.468 2.346
mainland radius lengths 0.527 0.009 1.045 6.849 0.494 0.047
CL2 intercept 0.313 0.808 1.433
mainland radius lengths 0.814 0.405 1.222 23.726 0.795 0.003
Dependent variable: island humerus lengths.
nificant effect when SRs were compared at the same com- land populations (both log transformed) gives a slope not
petition level (CL) for long bones (CL1: df 2, F 3.158, significantly different from one (intercept 0.016; slope
P 0.150; CL2: df 3, F 1.757, P 0.242; CL3: df 0.898, 95% CI 0.795–1.001). The slope of the regression
2, F 0.233, P 0.802). Ancestral species identity signif- of humeri lengths is significantly lower than one (intercept
icantly affects SR at predation level (PL) 1 (df 2, F 0.624; slope 0.679, 95% CI 0.385–0.973). Within
11.431 P 0.002), but this result is not significant after the competition levels, however, regression of SR on mass using
gigantic Crete deer C. dorothoensis and C. major are removed. either M 3 or humerus lengths had slopes not different from
At PL3 (df 2, F 4.363 P 0.100) ancestry is not a one (Table 3). Similar patterns are obtained regardless of the
significant factor. We did not analyze ancestral effects at PL2 metric used to calculate SR (Appendix 4 available online
because of a small sample size. No significant effect of an- only at http://dx.doi.org/10.1554/05-664.1.s4).
cestry was found when we analyzed tooth sizes at different
competition (CL1: df 3, F 15.961, P 0.059; CL2: df Size Overdispersion Hypothesis
4, F 0.295, P 0.868; CL3: df 2, F 0.056, P
0.949) and predation levels (PL1: df 3, F 0.563, P Irrespective of which taxonomy we adopted, Barton-David
0.659; PL2: df 2, F 0.158, P 0.872, PL3: df 2, F tests indicate that the body sizes of deer on Crete were ov-
0.952, P 0.479). Guild membership does not affect SR erdispersed: data from Capasso Barbato (1988); G 14 0.88,
for either long bones (df 1, F 1.135, P 0.367) or teeth P 0.001; G 13 0.91, P 0.0032; G 24 0.89, P 0.0068.
(df 1, F 1.230, P 0.334). Data from Vos (1979); G 14 0.44, P 0.01; G 13 0.44,
Regressing M 3 lengths of insular species on those of main- P 0.07; G 24 0.783, P 0.003.
Carnivore Resource-Competition Hypothesis
Data on localities, sample sizes, sex, and CBL of 131 is-
land/mainland population pairs of modern carnivores, as well
as diets and the relative size, predation pressures, interspecific
competition, and resource base attributes are listed in Ap-
pendix 5 (avilable online only at http://dx.doi.org/10.1554/
05-664.1.s5). Because the categories we use are not contin-
uous (e.g., category 2 of larger competitor does not imply
twice as strong a competition force as category 1), we urge
the reader to view our results as qualitative rather than quan-
titative. Resource base is the sole significant factor and is
positively correlated with size change (n 130, 0.550,
P 0.0001, Fig. 2). Other factors are not significant (sex,
0.072, P 0.16; mass, 0.02, P 0.83; diet,
0.013, P 0.87; predation, 0.110, P 0.29; smaller
competitor, 0.058, P 0.52; larger competitor
0.140, P 0.16; area, 0.052, P 0.59). Combining
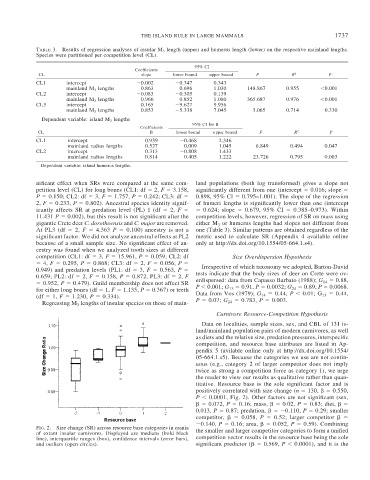
FIG. 2. Size change (SR) across resource base categories in crania
of extant insular carnivores. Displayed are medians (bold black the smaller and larger competitor categories to form a unified
line), interquartile ranges (box), confidence intervals (error bars), competition vector results in the resource base being the sole
and outliers (open circles). significant predictor ( 0.569, P 0.0001), and it is the