
Page 4 - Thymus_BSE
P. 4
L. Llorens et al. / Biochemical Systematics and Ecology 56 (2014) 246e254 249
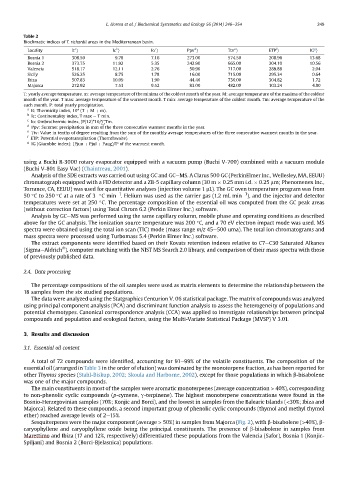
Table 2
Bioclimatic indices of T. richardii areas in the Mediterranean basin.
c
d
a
b
g
e
Locality It ) Ic ) Io ) Ppv ) Ttv ) ETP ) f IG )
Bosnia 1 308.50 9.78 7.16 273.00 574.50 208.96 13.68
Bosnia 2 373.75 11.92 5.35 242.90 665.00 204.10 10.56
Valencia 518.17 12.11 2.76 50.90 717.00 289.88 2.04
Sicily 526.25 8.75 1.78 16.00 715.00 295.34 0.64
Ibiza 507.83 10.09 1.90 44.40 730.00 304.82 1.72
Majorca 272.92 7.53 9.52 83.00 482.00 103.24 4.80
T: yearly average temperature. m: average temperature of the minima of the coldest month of the year. M: average temperature of the maxima of the coldest
month of the year. T max: average temperature of the warmest month. T min: average temperature of the coldest month. Tm: average temperature of the
each month. P: total yearly precipitation.
a It: Thermicity index, 10* (T þ M þ m).
b
Ic: Continentality index, T max e T min.
c Io: Ombrothermic index, (P/12)*10/ P Tm.
d
Ppv: Summer precipitation in mm of the three consecutive warmest months in the year.
e
Ttv: Value in tenths of degree resulting from the sum of the monthly average temperatures of the three consecutive warmest months in the year.
f
ETP: Potential evapotranspiration (Thornthwaite).
g
IG (Giacobbe index): (Pjun þ Pjul þ Paug)/Tª of the warmest month.
using a Buchi R-3000 rotary evaporator equipped with a vacuum pump (Buchi V-700) combined with a vacuum module
(Buchi V-801 Easy Vac) (Chaintreau, 2001).
Analysis of the SDE extracts was carried out using GC and GCeMS. A Clarus 500 GC (PerkinElmer Inc., Wellesley, MA, EEUU)
chromatograph equipped with a FID detector and a ZB-5 capillary column (30 m 0.25 mm i.d. 0.25 mm; Phenomenex Inc.,
Torrance, CA, EEUU) was used for quantitative analyses (injection volume 1 mL). The GC oven temperature program was from
1
50 C to 250 C at a rate of 3 C min . Helium was used as the carrier gas (1.2 mL min 1 ), and the injector and detector
temperatures were set at 250 C. The percentage composition of the essential oil was computed from the GC peak areas
(without correction factors) using Total Chrom 6.2 (Perkin Elmer Inc.) software.
Analysis by GCeMS was performed using the same capillary column, mobile phase and operating conditions as described
above for the GC analysis. The ionization source temperature was 200 C, and a 70 eV electron impact mode was used. MS
spectra were obtained using the total ion scan (TIC) mode (mass range m/z 45e500 uma). The total ion chromatograms and
mass spectra were processed using Turbomass 5.4 (Perkin Elmer Inc.) software.
The extract components were identified based on their Kovats retention indexes relative to C7eC30 Saturated Alkanes
®
(SigmaeAldrich ), computer matching with the NIST MS Search 2.0 library, and comparison of their mass spectra with those
of previously published data.
2.4. Data processing
The percentage compositions of the oil samples were used as matrix elements to determine the relationship between the
18 samples from the six studied populations.
The data were analyzed using the Statgraphics Centurion V. 06 statistical package. The matrix of compounds was analyzed
using principal component analysis (PCA) and discriminant function analysis to assess the heterogeneity of populations and
potential chemotypes. Canonical correspondence analysis (CCA) was applied to investigate relationships between principal
compounds and population and ecological factors, using the Multi-Variate Statistical Package (MVSP) V 3.01.
3. Results and discussion
3.1. Essential oil content
A total of 72 compounds were identified, accounting for 91e99% of the volatile constituents. The composition of the
essential oil (arranged in Table 3 in the order of elution) was dominated by the monoterpene fraction, as has been reported for
other Thymus species (Stahl-Biskup, 2002; Skoula and Harborne, 2002), except for those populations in which b-bisabolene
was one of the major compounds.
The main constituents in most of the samples were aromatic monoterpenes (average concentration > 40%), corresponding
to non-phenolic cyclic compounds (p-cymene, g-terpinene). The highest monoterpene concentrations were found in the
Bosnio-Herzegovinian samples (70%; Konjic and Borci), and the lowest in samples from the Balearic Islands (<30%; Ibiza and
Majorca). Related to these compounds, a second important group of phenolic cyclic compounds (thymol and methyl thymol
ether) reached average levels of 2e15%.
Sesquiterpenes were the major component (average > 50%) in samples from Majorca (Fig. 2), with b-bisabolene (>40%), b-
caryophyllene and caryophyllene oxide being the principal constituents. The presence of b-bisabolene in samples from
Marettimo and Ibiza (17 and 12%, respectively) differentiated these populations from the Valencia (Safor), Bosnia 1 (Konjic-
Spiljani) and Bosnia 2 (Borci-Bjelasnica) populations.